Table of Contents
- Acknowledgements
- Introduction
- What is leaflet.js?
- What do you need to get started?
- Start With a Simple Map
- Leaflet Features
- Leaflet Plugins
- Assorted Leaflet Tips and Tricks
- Tile servers that can be used with Leaflet
- Map Tips and Tricks
- MySQL Tips and Tricks for leaflet.js
- Appendices
Acknowledgements
First and foremost I would like to express my thanks to Vladimir Agafonkin. He is the driving force behind leaflet.js. His efforts in bringing Leaflet to the World and constantly improving it are tireless and his altruism in making his work open and available to the masses is inspiring.
Vladimir has worked with a large collection of like-minded individuals in bringing Leaflet to the World. These contributors also deserve honours for the work on leaflet.js. At the time of writing there are over 100 contributors listed on GitHub and the project is listed as used by over 28 thousand other repositories.
Those who write the plugins also deserve a special thanks. In the same way that Leaflet provides an excellent framework to work on, the diversity and ingenuity of the available plugins is staggering. There are so many that I am not going to attempt to single any one out for individual praise. Instead, please accept my heartfelt thanks as a group of dedicated individuals.
I don’t want to forget to mention a special group that could be easily overlooked in receiving thanks here. The tile makers. If you’re not entirely sure what I mean by this, don’t worry, it will all become clearer as you read on. Without the map tiles, there would be no maps. These organisations provide a valuable resource that Leaflet leverages and I would like to recognise them as well.
Lastly, I want to pay homage to Leanpub who have made the publishing of this document possible. They offer an outstanding service for self-publishing and have made the task of providing and distributing content achievable.
Make sure you get the most up to date copy of Leaflet Tips and Tricks
If you’ve received a copy of this book from any location other than Leanpub then it’s possible that you haven’t got the latest version. Go to https://leanpub.com/leaflet-tips-and-tricks and download the most recent version. After all, it won’t cost you anything :-). If you find some value in the work, please consider donating when you download it so that Leanpub get something for hosting the book (and I’ll think of you fondly while I continue writing :-D).
Introduction
The idea of writing a book on Leaflet came about pretty much as soon as I first used it. It seemed so easy to use and I went looking for some books to help me through some of the more advanced topics. Since they are fairly scarce on the subject in 2014, I thought it would be a neat project to write one!
This decision has been supported mainly by the success of publishing my first book on d3.js called D3 Tips and Tricks. When I started writing D3 Tips and Tricks at the end of 2012 I had a desire to put out some documentation, but the method was a bit sketchy. I was lucky to stumble upon Leanpub while I was putting information together and it ticked all the boxes I was looking for in terms of being able to publish easily and distribute for free while providing the ability for people to get updates to the book when it gets improved. I tend to be a bit evangelical about Leanpub but the bottom line is that they provide a great service for people who want to publish a book in a flexible way.
Full disclosure: I am a simple user of this extraordinary framework and when I say simple, I really mean that there has been a lot of learning by trial-and-error (emphasis on the errors which are entirely mine). So to get from the point of having no knowledge on how to use Leaflet whatsoever to the point where I could begin to code up something to display data in a way I wanted, I had to capture the information as I went. The really cool thing about this sort of process is that it doesn’t need to occur all at once. You can start with no knowledge whatsoever (or pretty close) and by standing on the shoulders of others work, you can add building blocks to improve what you’re seeing and then change the blocks to adapt and improve. Another point to make is that there is cross-over between this book and D3 Tips and Tricks (in v3, v4 and v5!). So when you see portions that you think “Hey, that looks like it was cut and pasted from his other book”, There’s a good chance that you’ll be right and for good reason. However, each book has unique features and each should be able to be read in isolation.
The point to take away from all of this is that any online map is just a collection of lots of blocks of code, each block designed to carry out a specific function. Pick the blocks you want and implement them. Leaflet makes this easy and in particular their support for plugins actively encourages it. I found it was much simpler to work on one thing (block) at a time, and this helped greatly to reduce the uncertainty factor when things didn’t work as anticipated. I’m not going to pretend that everything I’ve done while trying to build maps employs the most elegant or efficient mechanism, but in the end, if it all works on the screen, I walk away happy :-). That’s not to say I have deliberately ignored any best practices – I just never knew what they were. Likewise, wherever possible, I have tried to make things as extensible as possible. You will find that I have typically eschewed a simple “Use this code” approach for more of a story telling exercise. This means that some explanations are longer and more flowery than might be to everyone’s liking, but there you go, try to be brave :-).
I’m sure most authors try to be as accessible as possible. I’d like to do the same, but be warned… There’s a good chance that if you ask me a technical question I may not know the answer. So please be gentle with your emails :-).
Email: d3noobmail+leaflet@gmail.com
What is leaflet.js?
Leaflet.js is an Open Source JavaScript library that makes deploying maps on a web page easy. Being Open Source means that the code can be easily viewed to see how it works, anyone can use it and more importantly anyone can contribute back to the project with improvements to the code.
To provide all this mapping goodness it uses a paltry 140kB (at time of writing) JavaScript file that loads with your web page and provides access to a range of functions that will allow you to present a map. There is support for modern browsers in desktop and mobile platforms so you can deploy your map pretty much anywhere.
Its goals are to be simple to use while focussing on performance and usability, but it’s also built to be extended using plugins that extend its functionality. It has an excellent API which is well documented, so there are no mysteries to using it successfully in a range of situations. Companies who are already touted as using Leaflet include Flickr, foursquare, GitHub, Data.gov, IGN, The Washington Post, OSM, Evernote, Financial Times, Pintrest and Open Street Map. Now I’m picking that you’ll agree that that’s a list of significant players on the Internet. However, with Leaflet, you can make and deploy maps in much that same way that these organisations do.
Out of the box Leaflet provides the functionality to add markers, popups, overlay lines and shapes, use multiple layers, zoom, pan and generally have a good time :-). But these are just the the core features of Leaflet. One of the significant strengths of Leaflet is the ability to extend the functionality of the script with plugins from third parties. At the time of writing there are hundreds of separate plugins that allow features such as overlaying a heatmap, animating markers, loading csv files of data, drawing complex shapes, measuring distance, manipulating layers and displaying coordinates.
Leaflet is truly a jewel of Open Source software. Simple, elegant, functional but powerful. There’s a good chance that even if you don’t present maps with Leaflet, you’ll be using ones that someone else made with it at some stage on the Internet.
What do you need to get started?
To be perfectly honest, not everyone will feel comfortable publishing a map on a web page.
However, that doesn’t mean that it’s beyond those with a little computer savy and a willingness to experiment. Remember failure is your friend (I am fairly sure that I am also related by blood). Just learn from your mistakes and it’ll all work out.
So, here in no particular order is a list of good things to know. None of which are essential, but any one (or more) of which will make your life slightly easier.
- HyperText Markup Language (HTML)
- JavaScript
- Cascading Style Sheets (CSS)
- Web Servers
- PHP
HTML
This stands for HyperText Markup Language and is the stuff that web pages are made of. Check out the definition and other information on Wikipedia for a great overview. Just remember that all you’re going to use HTML for is to hold the code that you will use to present your information. This will be as a .html (or .htm) file and they can be pretty simple (we’ll look at some in a moment).
JavaScript
JavaScript is what’s called a ‘scripting language’. It is the code that will be contained inside the HTML file that will make Leaflet do all its fanciness. In fact, leaflet.js is a JavaScript Library, it’s the native language for using Leaflet.
Knowing a little bit about this would be really good, but to be perfectly honest, I didn’t know anything about it before I started using d3.js. I read a book along the way (JavaScript: The Missing Manual from O’Reilly) and that helped with context, but the examples and tutorials that are available for Leaflet are understandable, and with a bit of trial and error, you can figure out what’s going on.
In fact, most of what this collection of information’s about is providing examples and explanations for the JavaScript components of Leaflet.
Cascading Style Sheets (CSS)
Cascading Style Sheets (everyone appears to call them ‘Style Sheets’ or ‘CSS’) is a language used to describe the formatting (or “look and feel”) of a document written in a markup language. The job of CSS is to make the presentation of the components you will draw with Leaflet simpler by assigning specific styles to specific objects. One of the cool things about CSS is that it is an enormously flexible and efficient method for making everything on the screen look more consistent and when you want to change the format of something you can just change the CSS component and the whole look and feel of your maps will change.
Web Servers
Ok, this can go one of two ways. If you have access to a web server and know where to put the files so that you can access them with your browser, you’re on fire. If you’re not quite sure, read on…
A web server will allow you to access your HTML files and will provide the structure that allows it to be displayed on a web browser. I can thoroughly recommend WampServer as a free and simple way to set up a local web server that includes PHP and a MySQL database. Go to the WampServer web page (http://www.wampserver.com/en/) and see if it suits you.
Throughout this document I will be describing the files and how they’re laid out in a way that has suited my personal efforts, but they will work equally well on a remote server. I will explain a little more about how I arrange the files later in the ‘Getting Leaflet’ section.

There are other options of course. You could host code on GitHub and present the resulting graphics on bl.ocks.org. You can also present and dynamically edit your code on the blockbuilder.org page. This is a great way to make sure that your code is available for peer review and sharing with the wider community.
PHP
PHP is a scripting language for the web. That is to say that it is a programming language which is executed when you load web pages and it helps web pages do dynamic things.
You might think that this sounds familiar and that JavaScript does the same thing. But not quite.
JavaScript is designed so that it travels with the web page when it is downloaded by a browser (the client). However, PHP is executed remotely on the server that supplies the web page. This might sound a bit redundant, but it’s a big deal. This means that the PHP which is executed doesn’t form part of the web page, but it can form the web page. The implication here is that the web page you are viewing can be altered by the PHP code that runs on a remote server. This is the dynamic aspect of it.
In practice, PHP could be analogous to the glue that binds web pages together. Allowing different portions of the web page to respond to directions from the end user.
It is widely recognised as both a relatively simple language to learn, but also a fairly powerful one. At the same time it comes into criticism for being somewhat fragmented and sometimes contradictory or confusing. But in spite of any perceived shortcomings, it is a very widely used and implemented language and one for which there is no obvious better option.
Other Useful Stuff
Text Editor
A good text editor for writing up your code will be a real boost. Don’t make the fatal mistake of using an office word processor or similar. THEY WILL DOOM YOU TO A LIFE OF MISERY. They add in crazy stuff that you can’t even see and never save the files in a way that can be used properly.
Preferably, you should get an editor that will provide some assistance in the form of syntax highlighting which is where the editor knows what language you are writing in (JavaScript for example) and highlights the text in a way that helps you read it. For example, it will change text that might appear as this;
Into something like this;
var map = L.map('map').setView([-41.2858, 174.78682], 14);
mapLink =
'<a href="http://openstreetmap.org">OpenStreetMap</a>';
L.tileLayer(
'http://{s}.tile.openstreetmap.org/{z}/{x}/{y}.png', {
attribution: '© ' + mapLink + ' Contributors',
maxZoom: 18,
}).addTo(map);
var marker = L.marker([-41.29042, 174.78219])
.addTo(map);
Infinity easier to use. Trust me.
There are plenty of editors that will do the trick. I have a preference for Geany, mainly because it’s what I started with and it grew on me :-).
Getting Leaflet
Luckily this is pretty easy.
You can either get it directly from leafletjs.com off their downloads page or even go to the Leaflet repository on github and download it by clicking on the ‘ZIP’ button (slightly trickier for the uninitiated).
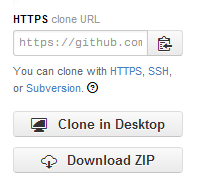
What you do with it from here depends on how you’re hosting your web pages. If you’re working on them on your local PC, then you will want to have the leaflet.js and leaflet.css files in paths that can be seen by the browser. Again, I would recommend WAMP (a local web server) to access your files locally. If you’re using WAMP, then you just have to make sure that it knows to use a directory that will contain the appropriate files and you will be away.
The important things to remember about placing the leaflet files that youdownload are as follows;
- leaflet.js - This should be placed with your html files.
- leaflet.css - This is the stylesheet file for Leaflet and should also be placed with your html files.
- images - This is a folder that contains images used by leaflet.css. It should be placed with your leaflet.css file.
Access Leaflet via a CDN (Content Delivery Network)
A CDN is an area on the Internet that will host files for reference by other projects. This makes it easy to get the latest stable release and to use it without having to download and then update your own version.
The latest stable release of Leaflet is available on several CDN’s - just place this in the head of your HTML code:
<link
    rel="stylesheet"
    href="https://unpkg.com/leaflet@1.6.0/dist/leaflet.css"
/>
<script
    src="https://unpkg.com/leaflet@1.6.0/dist/leaflet.js"
></script>
Sometimes you will strike trouble using these due to a security feature that browsers use to prevent downloading malicious code. This prevents what is called CORS (Cross Origin Resource Sharing). This will be evident to users of blockbuilder.org and leaflet.js. This can be overcome by enabling subresource integrity when using Leaflet from a CDN as follows;
<link
  rel="stylesheet"
  href="https://unpkg.com/leaflet@1.6.0/dist/leaflet.css"
  integrity="sha512-xwE/Az9zrjBIphAcBb3F6JVqxf46+CDLwfLMHloNu6KEQCAWi6HcDUbeOfBIp\
tF7tcCzusKFjFw2yuvEpDL9wQ=="
  crossorigin=""/>
<script
  src="https://unpkg.com/leaflet@1.6.0/dist/leaflet.js"
  integrity="sha512-gZwIG9x3wUXg2hdXF6+rVkLF/0Vi9U8D2Ntg4Ga5I5BZpVkVxlJWbSQtXPSiU\
TtC0TjtGOmxa1AJPuV0CPthew=="
  crossorigin=""></script>
Where to get information on leaflet.js
Leaflet already has a great home page where you can find an awesome range of support information, but there are other useful places to go. The following is a far from exhaustive list of sources, but from my own experience it represents a handy subset of knowledge.
leafletjs.com
leafletjs.com would be the first port of call for people wanting to know something about leaflet.js.
From here you can; - Access the features list to get an overview of the strengths of Leaflet. - Check out some tutorials on common things that you will want to do with Leaflet. - Read the extensive API documentation that will be a treasure trove of information as you use Leaflet. - Find links to an extensive list of plugins that you can use with Leaflet. - Get updates on the progress of Leaflet development on the developer blog.
It is difficult to overstate the volume of available information that can be accessed from leafletjs.com. It stands alone as the one location that anyone interested in Leaflet should visit.
Google Groups
There is a Google Group dedicated to discussions on leaflet.js. This serves as the official Leaflet community forum.
In theory this forum is for discussion of any Leaflet-related topics that go beyond the scope of a simple GitHub issue report — ideas, questions, troubleshooting, feedback, etc.
So, by all means add this group as a favourite and this will provide you with the opportunity to receive emailed summaries of postings or just an opportunity to easily browse recent goings-on.
Stack Overflow
Stack Overflow is a question and answer site whose stated desire is “to build a library of detailed answers to every question about programming”. Ambitious. So how are they doing? Actually really well. Stack overflow is a fantastic place to get help and information. It’s also a great place to help people out if you have some knowledge on a topic.
They have a funny scheme for rewarding users that encourages providing good answers based on readers voting. It’s a great example of gamification working well. If you want to know a little more about how it works, check out this page; http://stackoverflow.com/about.
They have a leaflet tag (http://stackoverflow.com/questions/tagged/leaflet) and like Google Groups there is a running list of different topics that are an excellent source of information.
Github
Github is predominantly a code repository and version control site. It is highly regarded for its technical acumen and provide a fantastic service that is broadly used for many purposes.
Whilst not strictly a site that specialises in providing a Q & A function, there is a significant number of repositories (many thousands at last count) which mention leaflet. With the help from an astute search phrase, there is potentially a solution to be found there.
The other associated feature of Github is Gist. Gist is a pastebin service (a place where you can copy and past code) that can provide a ‘wiki like’ feature for individual repositories and web pages that can be edited through a Git repository. Gist plays a role in providing the hub for the bl.ocks.org example hosting service set up by Mike Bostock.
For a new user, Github / Gist can be slightly daunting. It’s an area where you almost need to know what’s going on to know before you dive in. This is certainly true if you want to make use of it’s incredible features that are available for hosting code. However, if you want to browse other peoples code it’s an easier introduction. Have a look through what’s available and if you feel so inclined, I recommend that you learn enough to use their service. It’s time well spent.
bl.ocks.org
bl.ocks.org is a viewer for code examples which are hosted on Gist. You are able to load your code into Gist, and then from bl.ocks.org you can view them.
This is a really great way for people to provide examples of their work and there are many who do. However, it’s slightly tricky to know what is there. It is my intention as I write this book to host examples here, so hopefully I don’ have to come back and edit this sentence :-).
I would describe the process of getting your own code hosted and displaying as something that will be slightly challenging for people who are not familiar with Github / Gist, but again, in terms of visibility of the code and providing an external hosing solution, it is excellent and well worth the time to get to grips with.
The partner to bl.ocks.org (not literally) is the site blockbuilder.org. This acts as an area where Gists or bl.ocks can be edited live and displayed and shared. It works in conjunction with GitHub (in much the same way that bl.ocks.org does).
Twitter provides a great alerting service to inform a large disparate group of people about stuff.
It’s certainly a great way to keep in touch on a hour by hour basis with people who are involved with Leaflet and this can be accomplished in a few ways. First, there is the official Leaflet Twitter identity hosted by Vladimir (AKA @mourner). Second, find as many people from the various Leaflet sites around the web who you consider to be influential in areas you want to follow (different aspects such as development, practical output, educational etc) and follow them. Even better, I found it useful to find a small subset who I considered to be influential people and I noted who they followed. It’s a bit ‘stalky’ if you’re unfamiliar with it, but the end result should be a useful collection of people with something useful to say.
Tutorials
There are a good number of tutorials hosted on leaflet.com. Visit to get a good overview of a range of tools and techniques to extend your skills with Leaflet.
Start With a Simple Map
We will walk through the building of a simple web page using an HTML file. The page will host a Leaflet map so that we can understand all the different portions of the file and the processes that needs to be gone through to make it happen.
The following is the full code listing of the file simple-map.html that we will be examining;
<!DOCTYPE html>
<html>
<head>
<title>Simple Leaflet Map</title>
<meta charset="utf-8" />
<link rel="stylesheet" href="leaflet.css" />
</head>
<body>
<script src="leaflet.js"></script>
<div id="map" style="width: 600px; height: 400px"></div>
<script>
var map = L.map('map').setView([-41.2858, 174.78682], 14);
mapLink =
'<a href="http://openstreetmap.org">OpenStreetMap</a>';
L.tileLayer(
'http://{s}.tile.openstreetmap.org/{z}/{x}/{y}.png', {
attribution: '© ' + mapLink + ' Contributors',
maxZoom: 18,
}).addTo(map);
</script>
</body>
</html>
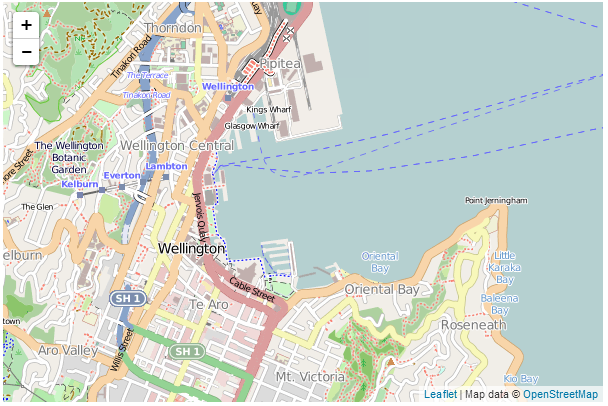
The output that it will produce on a web page will look like this;
You can access an electronic version from bl.ocks.org, GitHub and there is a copy of this file called simple-map.html that can be downloaded (in a zip file) when you download the book from Leanpub. The online version at bl.ocks.org and GitHub both use subresource integrity to support secure CORS CORS (Cross Origin Resource Sharing) requests.
You can pan the map by pressing an holding the left mouse button and waving it about and you can zoom in and out of the map by either clicking on the + or - buttons or using a scroll wheel.
As you can tell from the code listing, there’s not much there, so what you can take from that is that there is a significant amount of cleverness going on inside leaflet.js.
Once we’ve finished explaining the different parts of the code, we’ll start looking at what we need to add in and adjust so that we can incorporate other useful functions.
The two parts to the code that we in our example to consider are;
- HTML
- JavaScript
HTML
Here’s the HTML portions of the code;
<!DOCTYPE html>
<!DOCTYPE html>
<html>
<head>
    <title>Simple Leaflet Map</title>
    <meta charset="utf-8" />
    <link rel="stylesheet" href="leaflet.css" />
</head>
<body>
    <script src="leaflet.js"></script>

    <div id="map" style="width: 600px; height: 400px"></div>

    <script>

        The _leaflet_ JavaScript code is here

    </script>
</body>
</html>
Compare it with the full file. It obviously comprises most of the code for the web page which should tell you two things.
- The JavaScript portion that draws the map is really small (and therefore it should hopefully be pretty easy to understand (Spoiler alert: It is)).
- The heavy lifting done by leaflet.js must be pretty clever.
There are plenty of good options for adding additional HTML stuff into this very basic part for the file, but for what we’re going to be doing, we really don’t need to make things too difficult.
HTML works its magic by enclosing instructions for the browser in specific ‘tags’ A tag will begin with a descriptive word inside the greater-than and less-than signs and end with the same thing except the closing tag includes a backslash. There are also tags that allow including the contents inside a single tag that is closed off with a backslash. This appears to be connected with XHTML and sometimes with browser variants. To be perfectly honest I have trouble keeping up with it all.
For example, the title of our web page is ‘Simple Leaflet Map’. This is enclosed by an opening title tag (<title>) and a closing title tag (</title>). So that the whole thing looks like this; <title>Simple Leaflet Map</title>.
Each tag has a function and the browser will know how to execute the contents of a tag by virtue of standards for web browsers that builders of browsers implement. Tags can also be nested so hierarchies can be established to create complex instructions.
For example contained within our <head> tags;
<head>
    <title>Simple Leaflet Map</title>
    <meta charset="utf-8" />
    <link rel="stylesheet" href="leaflet.css" />
</head>
We can see the <title>, a <meta> tag and a <link> tag.
The title tag simply provides identification for the page. The <meta> tag defines the character set that is used for the page. But the link tag is a little different.
In this case we need to load a set of styles for Leaflet to use. In this case we are loading them from a local file (in the same directory as our html file ‘simple-map.html’), In the online versions at bl.ocks.org and GitHub we use online files instead.
Inside the <body> tags we have two interesting sections.
The first is…
<div id="map" style="width: 600px; height: 400px"></div>
A <div> tag defines a division or a section in an HTML document. As well as creating a section we use an ID selector (id="map") as a way of naming the division as an anchor point on an HTML page. ID selectors can be defined as “a unique identifier to an element”. Which means that we can name a position on our web page and then we can assign our map to that position. Lastly for our division, we specify the size with a style declaration of width: 600px; height: 400px.
The second is…
<script src="leaflet.js"></script>
This tells the browser that we are loading a script (hence the <script> tags) and in this case, the script is leaflet.js which we get from a local file. This is using the same idea as we used for the css file.
JavaScript
The JavaScript portion of our code looks like this;
var map = L.map('map').setView([-41.2858, 174.78682], 14);
mapLink =
'<a href="http://openstreetmap.org">OpenStreetMap</a>';
        L.tileLayer(
            'http://{s}.tile.openstreetmap.org/{z}/{x}/{y}.png', {
            attribution: '© ' + mapLink + ' Contributors',
            maxZoom: 18,
            }).addTo(map);
Firstly I have to apologise since it should look slightly simpler, but in order to make the code appear ideal for the book I have made it slightly less simple (but only slightly). But the main thing that we can take away from this piece of code is that there’s not very much there. The process of presenting a map on a web page has been rendered to a very few lines of code.
The heart of the process in the code above consists of two actions;
- Declare the starting parameters for the map.
- Declare the source of the map tiles.
Declaring the starting parameters for the map
The L.map statement is the key function to create a map on a page and manipulate it.
var map = L.map('map').setView([-41.2858, 174.78682], 14);
It takes the form;
Where the map object is instantiated given an appropriate div element or its id and (optional) map state options.
In our example it is declared as a variable using var map =. The id is set as map (recall that we declared a div with the id map in our HTML section).
The .setView method is used specifically to modify our map state. In this case setView sets the geographical centre of the map ([-41.2858, 174.78682] is the latitude and longitude of the centre point) and the zoom level (14).
If this all seems a bit rushed in terms of an explanation, never fear as we will go over as many mysteries of maps as possible in other sections of the book.
Declaring the source for the map tiles
The L.tileLayer function is used to load and display tile layers on the map.
L.tileLayer(
'http://{s}.tile.openstreetmap.org/{z}/{x}/{y}.png', {
attribution: '© ' + mapLink + ' Contributors',
maxZoom: 18,
}).addTo(map);
It takes the form;
The urlTemplate is a string in the form http://{s}.mapdomain.org/{z}/{x}/{y}.png, where the {s} will allow one of the subdomains of the main domain to be used. These are typically used sequentially to make loading the map faster by allowing multiple parallel requests. The {z} declares the zoom level and the {x} and {y} define the tile coordinates. We will look closely at how these urls are formed in a future section of the book since they are an interesting feature in themselves and it is useful to understand their working in relation to the map being displayed.
The TileLayer options provides scope for a range of different options when loading or displaying the tiles. We will go over all of them in a later section.
In our example we are retrieving our tiles from openstreetmap.org and setting options for attribution and maxZoom.
attribution is the placing of appropriate reference to the source of the tiles. The idea is to ensure that credit (and copyright acknowledgement) is provided to the tile provider as is reasonable. In the example used here we place the words ‘Map Data’ and then a copyright symbol (which is produced by the text ©) followed by the variable mapLink which is declared slightly earlier in the JavaScript code and is set to <a href="http://openstreetmap.org">OpenStreetMap</a> which provides the text OpenStreetMap and a link to openstreetmap.org. The end result looks like this;

maxZoom sets the maximum zoom level of the map.
The .addTo method adds the tiles to the map.
And there’s your map!
Too easy right?
Now, there is a strong possibility that the information I have laid out here is at best borderline useful and at worst laden with evil practices and gross inaccuracies. But look on the bright side. Irrespective of the nastiness of the way that any of it was accomplished or the inelegance of the code, if the map drawn on the screen is effective, you can walk away with a smile. :-)
This section concludes a very basic description of one way of presenting a map on a web page. We will look as adding value to it in subsequent chapters.
I’ve said it before and I’ll say it again. This is not strictly a how-to for learning how to implement leaflet.js. This is how I have managed to muddle through in a bumbling way to try and put maps on a screen. If some small part of it helps you. All good. Those with a smattering of knowledge of any of the topics I have butchered above (or below) are fully justified in feeling a large degree of righteous indignation. To those I say, please feel free to amend where practical and possible, but please bear in mind this was written from the point of view of someone with little to no experience in the topic and therefore try to keep any instructions at a level where a new entrant can step in.
Leaflet Features
Adding a marker to our map
At some stage we will most likely want to add a marker to our map to pinpoint something. Leaflet makes the process nice and easy by including a marker function with several options;
In its most simple form the following is the full code to show a map with a marker;
<!DOCTYPE html>
<html>
<head>
<title>Leaflet Map</title>
<meta charset="utf-8" />
<link rel="stylesheet" href="leaflet.css" />
</head>
<body>
<script src="leaflet.js"></script>
<div id="map" style="width: 600px; height: 400px"></div>
<script>
var map = L.map('map').setView([-41.2858, 174.78682], 14);
mapLink =
'<a href="http://openstreetmap.org">OpenStreetMap</a>';
L.tileLayer(
'http://{s}.tile.openstreetmap.org/{z}/{x}/{y}.png', {
attribution: '© ' + mapLink + ' Contributors',
maxZoom: 18,
}).addTo(map);
        var marker = L.marker([-41.29042, 174.78219])
            .addTo(map);
</script>
</body>
</html>
The only difference between this code and the simple map code is the addition of a single line at the bottom of the JavaScript portion;
var marker = L.marker([-41.29042, 174.78219])
.addTo(map);
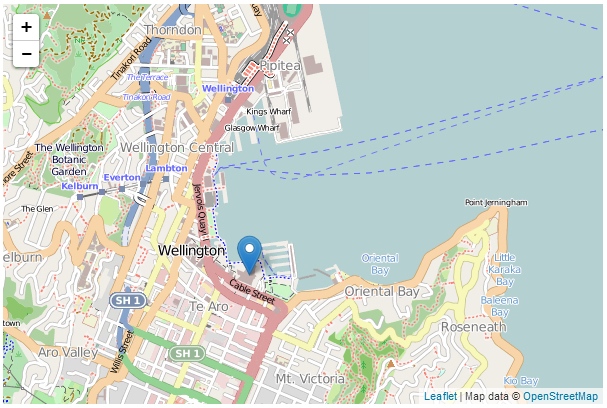
Here we are declaring a variable with the L.marker method at a point of latitude -41.29042 and longitude 174.78219. Then we simply add that to our map by adding .addTo(map).
And here’s our map complete with marker…
Adding a popup to our marker
Adding a marker couldn’t be any easier, but it’s also not terribly informative in this context. After all, we have no information on what our marker is pointing to. However we can add this context in the form of a popup which is a small text bubble associated with the marker. To do this the code for our marker should look like this;
        var marker = L.marker([-41.29042, 174.78219])
            .addTo(map)
            .bindPopup("<b>Te Papa</b><br>Museum of New Zealand.")
            .openPopup();
Here our additional lines bind a popup to our marker using .bindPopup with the text <b>Te Papa</b><br>Museum of New Zealand. (where the <b> tags will make the text bold and the <br> tag will insert a line break). Then we open the popup with .openPopup().
The end result is…
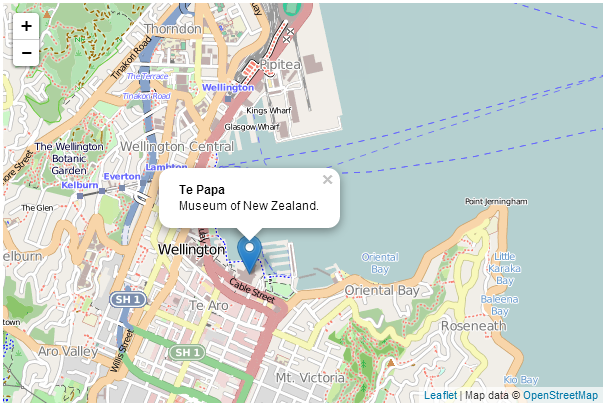
But wait! The coolness doesn’t end there. You can click on the marker and the popup will alternately disappear and return. If you omit the .openPopup() portion the popup won’t be open when your map loads, but if you click on the marker it will open up.
Marker options
As well as the standard marker functions shown thus far there are several options that can be utilised when displaying a marker. These are enabled by including an array of the appropriate options and their desired values in a section contained in curly braces after the latitude, longitude declaration. Below there is some sample code for the marker function with three different options demonstrating use for a boolean value (true / false) a string and a number.
    var marker = L.marker([-41.29042, 174.78219],
        {option1: true,                 // a boolean value
        option2: 'a string lives here', // a string
        option3: 1234}                  // a number
        )
       .addTo(map);
Drag a marker
The draggable option is a boolean which is set to false by default, but when set to true, the marker can be repositioned by clicking on it with the mouse and moving it.
The following is a code example;
    var marker = L.marker([-41.29042, 174.78219],
        {draggable: true}
        )
       .addTo(map);
Add a title to a marker
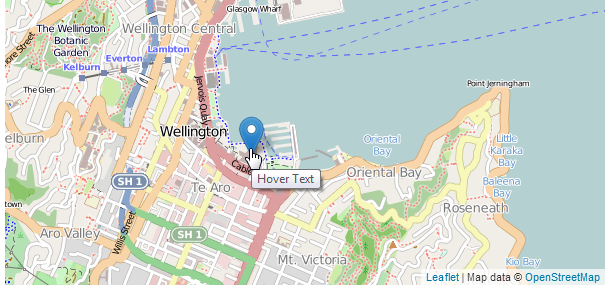
The title option is a string which will be displayed in a small rectangle beside the pointer when a users mouse is hovered over the marker.
The following is a code example;
    var marker = L.marker([-41.29042, 174.78219],
        {title: 'Hover Text'}
        )
       .addTo(map);
And this is what it looks like…
Adjust the markers transparency
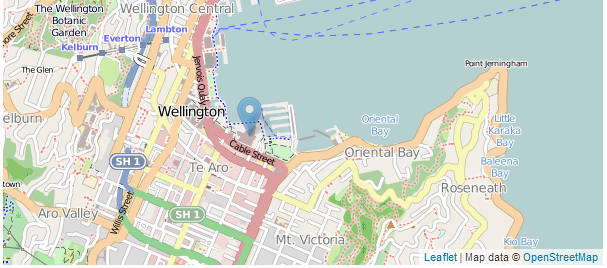
The opacity option will vary the transparency of the marker from 0 (transparent) to 1 (opaque).
The following is a code example;
    var marker = L.marker([-41.29042, 174.78219],
        {opacity: 0.5}
        )
       .addTo(map);
And this is what it looks like…
. A copy is also in the appendices and a copy of all the files that appear in the book can be downloaded (in a zip file) when you download the book from Leanpub.
The full code of a live example of a map incorporating a marker with a popup, draggability, a title and opacity are available from bl.ocks.org, GitHub and there is a copy of this file called marker-map-complex.html that can be downloaded (in a zip file) when you download the book from Leanpub. The online version at bl.ocks.org and GitHub both use subresource integrity to support secure CORS CORS (Cross Origin Resource Sharing) requests.
Adding multiple markers to our map
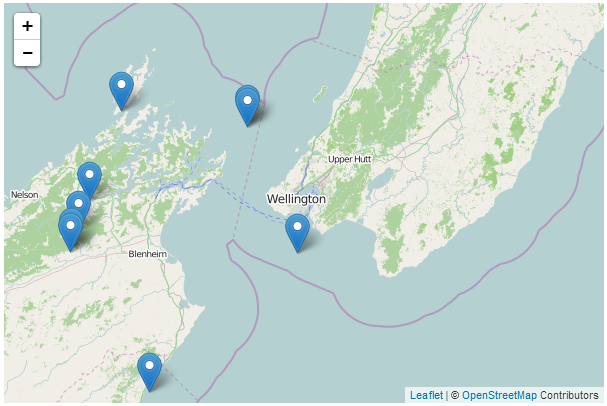
At some stage we will most likely want to add multiple markers to our map to pinpoint several things. While we could do this one by one following the previous example, we could also do it programmatically with an array of data.
The following is the full code to show multiple markers on a map;
<!DOCTYPE html>
<html>
<head>
<title>Leaflet Map</title>
<meta charset="utf-8" />
<link rel="stylesheet" href="leaflet.css" />
</head>
<body>
<script src="leaflet.js"></script>
<div id="map" style="width: 600px; height: 400px"></div>
<script>
	var planes = [
		["7C6B07",-40.99497,174.50808],
		["7C6B38",-41.30269,173.63696],
		["7C6CA1",-41.49413,173.5421],
		["7C6CA2",-40.98585,174.50659],
		["C81D9D",-40.93163,173.81726],
		["C82009",-41.5183,174.78081],
		["C82081",-41.42079,173.5783],
		["C820AB",-42.08414,173.96632],
		["C820B6",-41.51285,173.53274]
		];
var map = L.map('map').setView([-41.3058, 174.82082], 8);
mapLink =
'<a href="http://openstreetmap.org">OpenStreetMap</a>';
L.tileLayer(
'http://{s}.tile.openstreetmap.org/{z}/{x}/{y}.png', {
attribution: '© ' + mapLink + ' Contributors',
maxZoom: 18,
}).addTo(map);
		for (var i = 0; i < planes.length; i++) {
			marker = new L.marker([planes[i][1],planes[i][2]])
				.bindPopup(planes[i][0])
				.addTo(map);
		}
</script>
</body>
</html>
The full code of a live example of a map incorporating multiple markers is available online at bl.ocks.org or GitHub. A copy can also be downloaded (in a zip file) when you download the book from Leanpub. It’s called multiple-markers.html.
There are two differences between this code and the code to add a single marker. Firstly we have declared an array (planes) which has a range of values with each row including an identifier (the first column) and latitude and longitude values.
var planes = [
["7C6B07",-40.99497,174.50808],
["7C6B38",-41.30269,173.63696],
["7C6CA1",-41.49413,173.5421],
["7C6CA2",-40.98585,174.50659],
["C81D9D",-40.93163,173.81726],
["C82009",-41.5183,174.78081],
["C82081",-41.42079,173.5783],
["C820AB",-42.08414,173.96632],
["C820B6",-41.51285,173.53274]
];
Secondly we include a for loop that contains our marker adding line.
for (var i = 0; i < planes.length; i++) {
marker = new L.marker([planes[i][1],planes[i][2]])
.bindPopup(planes[i][0])
.addTo(map);
}
In the for loop we go from 0 to the end of the planes array (planes.length). For each row in our array, we add a marker where the latitude corresponds to planes[i][1] (in the planes array at row i and column 1 (remembering that the first column is 0)) and the longitude is planes[i][2]. We also add a popup to our marker with the identifier (planes[i][0]) before adding each marker to the map (.addTo(map)).
And here’s our map complete with markers…
Adding a line to our map
Adding a line to our map is a great way to provide an indication of a path or border. Leaflet provides the polyline function to do this;
The following is the full code to show a simple map with a line drawn with 4 lines;
<!DOCTYPE html>
<html>
<head>
<title>Simple Leaflet Map</title>
<meta charset="utf-8" />
<link rel="stylesheet" href="leaflet.css" />
</head>
<body>
<script src="leaflet.js"></script>
<div id="map" style="width: 600px; height: 400px"></div>
<script>
var map = L.map('map').setView([-41.2858, 174.78682], 14);
mapLink =
'<a href="http://openstreetmap.org">OpenStreetMap</a>';
L.tileLayer(
'http://{s}.tile.openstreetmap.org/{z}/{x}/{y}.png', {
attribution: '© ' + mapLink + ' Contributors',
maxZoom: 18,
}).addTo(map);
        var polyline = L.polyline([
            [-41.286, 174.796],
            [-41.281, 174.786],
            [-41.279, 174.776],
            [-41.290, 174.775],
            [-41.292, 174.788]]
            ).addTo(map);
</script>
</body>
</html>
The only difference between this code and the simple map code is the addition of the var polyline = section at the bottom of the JavaScript portion;
var polyline = L.polyline([
[-41.286, 174.796],
[-41.281, 174.786],
[-41.279, 174.776],
[-41.290, 174.775],
[-41.292, 174.788]]
).addTo(map);
Here we are defining a path going from one lat/long point to another. We declare a variable with the L.polyline method and step through our points in the array. Then we simply add that to our map by adding .addTo(map).
And here’s our map complete with path…
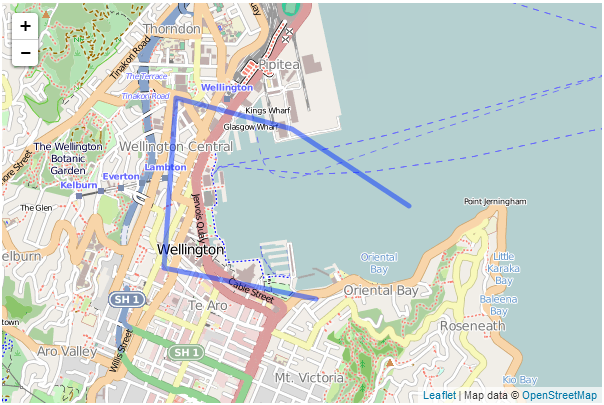
Obviously this hasn’t been set to follow any logical route :-).
Adding options to our polyline
There are a range of options that can be incorporated into our path and these are added after the array (separated by a comma) and contained in curly braces. The following is an example of the same line but with the colour changed to red, the width (weight) of the line set to 10 pixels, the opacity (transparency) set to 0.7 (on a scale of 0 (transparent) to 1 (opaque)), drawn with dashes of 20 pixels followed by a space of 15 pixels (dashArray) and with rounded corners where the lines join.
        var polyline = L.polyline([
            [-41.286, 174.796],
            [-41.281, 174.786],
            [-41.279, 174.776],
            [-41.290, 174.775],
            [-41.292, 174.788]
            ],
            {
                color: 'red',
                weight: 10,
                opacity: .7,
                dashArray: '20,15',
                lineJoin: 'round'
            }
            ).addTo(map);
And here’s our path with options…
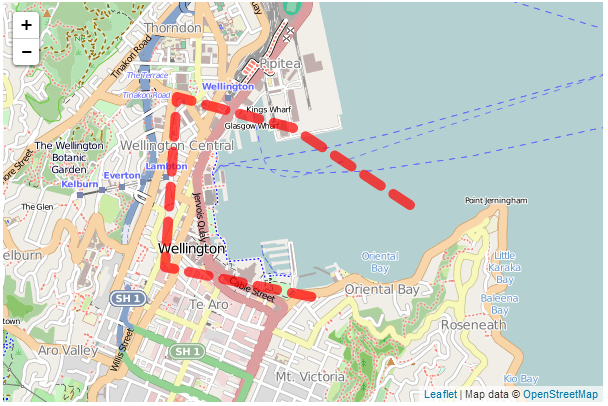
The full code of a live example of a map incorporating a the polyline and options is available online at bl.ocks.org or GitHub. A copy of the file (polyline-options-map) can be downloaded (in a zip file) when you download the book from Leanpub.
Using multiple tile layers on your map
Leaflet has a great feature that allows you to easily switch between tile layers when viewing your map. It’s built right in to leaflet.js and (as usual) it’s simple to implement.
What we’re going to do is define the locations and appropriate attributions for two different sets of tiles and then tell leaflet to place a control on the map that allows us to switch. These different sets of tiles are referred to as ‘base layers’ and as such only one can be visible at any one time.
The end result is a small icon in the top right hand corner that looks like this…

And when we hover over it with our mouse it changes to show the different tile layers that we have defined for use.

There is no change to the HTML part of our code from the simple map example. The full code for this example can be found here on GitHub and a working example is here on bl.ocks.org. A copy of the file (layers-map.html) can be downloaded (in a zip file) when you download the book from Leanpub.
The only change is in the JavaScript portion. and that looks like the following;
   var osmLink = '<a href="http://openstreetmap.org">OpenStreetMap</a>',
       otmLink = '<a href="http://opentopomap.org/">OpenTopoMap</a>';
   var osmUrl = 'http://{s}.tile.openstreetmap.org/{z}/{x}/{y}.png',
       osmAttrib = '© ' + osmLink + ' Contributors',
       otmUrl = 'http://{s}.tile.opentopomap.org/{z}/{x}/{y}.png',
       otmAttrib = '© '+otmLink+' Contributors';
   var osmMap = L.tileLayer(osmUrl, {attribution: osmAttrib}),
       otmMap = L.tileLayer(otmUrl, {attribution: otmAttrib});
   var map = L.map('map', {
       layers: [osmMap] // only add one!
	    })
        .setView([-41.2858, 174.78682], 14);
   var baseLayers = {
	   "OSM Mapnik": osmMap,
	   "Topogrophy": otmMap
	    };
L.control.layers(baseLayers).addTo(map);
The first block of code sets up the links that we will use for attribution;
var osmLink = '<a href="http://openstreetmap.org">OpenStreetMap</a>',
otmLink = '<a href="http://opentopomap.org/">OpenTopoMap</a>';
This just makes it easier to add later when juggling multiple layers.
The we declare the URLs for the tiles and the attributions to display;
var osmUrl = 'http://{s}.tile.openstreetmap.org/{z}/{x}/{y}.png',
osmAttrib = '© ' + osmLink + ' Contributors',
otmUrl = 'http://{s}.tile.opentopomap.org/{z}/{x}/{y}.png',
otmAttrib = '© '+otmLink+' Contributors';
Again, by declaring these as variables, the process of defining the distinct layers is simplified.
Which is what we do in the next block of code;
var osmMap = L.tileLayer(osmUrl, {attribution: osmAttrib}),
otmMap = L.tileLayer(otmUrl, {attribution: otmAttrib});
Declaring the layers like this is pretty handy since now we have a single variable for each layer that has all the information associated with it that is required to display the tiles for that layer.
Now we add the map with the following lines of code;
var map = L.map('map', {
layers: [osmMap] // only add one!
})
.setView([-41.2858, 174.78682], 14);
It looks a lot like our simple map example, but in this case we have added in an option called layers and set that to the osmMap layer. This will be the initial layer that is shown on the map/ I have a note there to say that it’s a good idea to only have one of your base layers in there. That’s because if you put more than two it will load both layers when the map first loads and we don’t need to do that unnecessarily.
The second last section of the code declares what our base layers are (there are other sorts of layers, but we’ll get to that later) and gives them appropriate text to display in the layers selection box.
var baseLayers = {
"OSM Mapnik": osmMap,
"Topogrophy": otmMap
};
Then the last line adds the control for the baseLayers to the map
L.control.layers(baseLayers).addTo(map);
For a fantastic way of finding different tile providers I can recommend heading to the preview page set up here.
As I mentioned earlier, the full code for this example can be found here on GitHub and a working example is here on bl.ocks.org. A copy of the file (layers-map.html) can be downloaded (in a zip file) when you download the book from Leanpub.
Overlaying information interactively on your map
In the previous section we described how to declare and switch between more than one tile layer. Tile layers are described as ‘base layers’ in the sense that only one of them will be visible at a time and they will form the ‘base’ of the map.
However, it is obvious that a really useful thing to be able to do would be to add information to our map so that different features or areas can be highlighted. These features or areas will exist on top of the base layer so that they have context. In Leaflet these can be set up as ‘overlays’ where an object or group of elements can be added to a map.
Overlays are treated in much the same way as base layers. In the sense that they are declared and controlled using similar methods but Leaflet is clever enough to recognise that as many overlays as desired can exist on an individual base layer.
What we aim to do is to add an overlay to one to our previous base layer switching example. The end result will be the same icon in the top right corner of the map;

But this time when we move our mouse over it, it will present an option to select ‘Interesting places’.

And when selected it will show a series of markers with a connecting line.
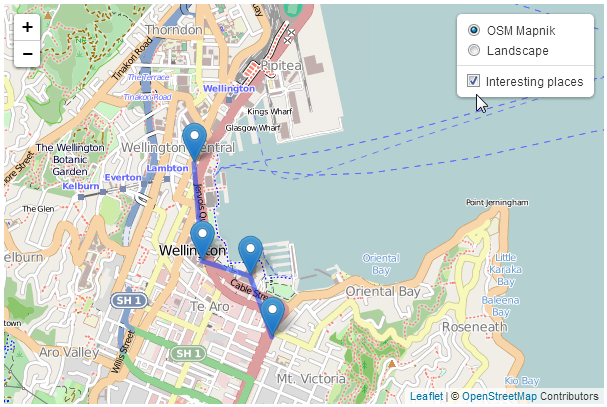
As with the base layer switching example, there is no change to the HTML part of our code from the simple map example. The full code for this example can be found here on GitHub and a working example is here on bl.ocks.org. A copy of the file (layers-map-overlays.html) can be downloaded (in a zip file) when you download the book from Leanpub.
The only change is in the JavaScript portion. and that looks like the following;
   var coolPlaces = new L.LayerGroup();

   L.marker([-41.29042, 174.78219])
       .bindPopup('Te Papa').addTo(coolPlaces),
   L.marker([-41.29437, 174.78405])
       .bindPopup('Embassy Theatre').addTo(coolPlaces),
   L.marker([-41.2895, 174.77803])
       .bindPopup('Michael Fowler Centre').addTo(coolPlaces),
   L.marker([-41.28313, 174.77736])
       .bindPopup('Leuven Belgin Beer Cafe').addTo(coolPlaces),
   L.polyline([
       [-41.28313, 174.77736],
       [-41.2895, 174.77803],
       [-41.29042, 174.78219],
       [-41.29437, 174.78405]
       ]
       ).addTo(coolPlaces);
var osmLink = '<a href="http://openstreetmap.org">OpenStreetMap</a>',
otmLink = '<a href="http://opentopomap.org/">OpenTopoMap</a>';
var osmUrl = 'http://{s}.tile.openstreetmap.org/{z}/{x}/{y}.png',
osmAttrib = '© ' + osmLink + ' Contributors',
otmUrl = 'http://{s}.tile.opentopomap.org/{z}/{x}/{y}.png',
otmAttrib = '© '+otmLink+' Contributors';
var osmMap = L.tileLayer(osmUrl, {attribution: osmAttrib}),
otmMap = L.tileLayer(otmUrl, {attribution: otmAttrib});
var map = L.map('map', {
layers: [osmMap] // only add one!
})
.setView([-41.2858, 174.78682], 14);
var baseLayers = {
"OSM Mapnik": osmMap,
"Topogrophy": otmMap
};
   var overlays = {
	   "Interesting places": coolPlaces
       };

   L.control.layers(baseLayers,overlays).addTo(map);
There are only really two differences between this block of script and that for the base layers example.
The first is where we define what our overlay will be made up of.
var coolPlaces = new L.LayerGroup();
L.marker([-41.29042, 174.78219])
.bindPopup('Te Papa').addTo(coolPlaces),
L.marker([-41.29437, 174.78405])
.bindPopup('Embassy Theatre').addTo(coolPlaces),
L.marker([-41.2895, 174.77803])
.bindPopup('Michael Fowler Centre').addTo(coolPlaces),
L.marker([-41.28313, 174.77736])
.bindPopup('Leuven Belgin Beer Cafe').addTo(coolPlaces),
L.polyline([
[-41.28313, 174.77736],
[-41.2895, 174.77803],
[-41.29042, 174.78219],
[-41.29437, 174.78405]
]
).addTo(coolPlaces);
Here we declare a new LayerGroup called coolPlaces (var coolPlaces = new L.LayerGroup();). Then we simply define a set of markers and a polyline (see the earlier sections on these two elements for a fuller description) and add them to our coolPlaces layer.
The second change to our code is right at the end of the block of code.
var overlays = {
"Interesting places": coolPlaces
};
L.control.layers(baseLayers,overlays).addTo(map);
Here we declare our overlays (there is only one (coolPlaces), but you can add as many as you want) using var overlays = {<put overlays here>}. Then we add overlays to our layers control so that it knows to include the layer in the screen widget.
And that’s all there is to it!
As stated earlier, the full code for this example can be found here on GitHub (and there’s a copy in the appendices) an online example is here on bl.ocks.org and copy of the file (layers-map-overlays.html) can be downloaded (in a zip file) when you download the book from Leanpub.
Leaflet Plugins
Since the stated aim of leaflet.js is to provide a JavaScript library for drawing maps that is simple, with good performance and usability, there are many features that it could include which it doesn’t. The idea being that not everyone is going to use those features, therefore there is no benefit to increasing the size of leaflet and impacting performance.
Instead the awesomeness of Leaflet is increased by encouraging third party contributors to craft their own plugins that can leverage the core library capabilities to expand functionality on a feature by feature basis.
At time of writing (December 2013) there are almost exactly 100 different plugins covering a huge range of options.
Leaflet.draw
Leaflet.draw adds support for drawing and editing vectors and markers overlaid onto Leaflet maps. Its driving force is Jacob Toye (a good Hamilton lad, so he gets a special shout-out :-)).
It is a comprehensive plugin that can add polylines, polygons, rectangles, circles and markers to a map and then edit or delete those objects as desired. It has an extensive range of options for configuring the drawing objects ‘look and feel’. It’s code is supported on GitHub and it can be downloaded from there. There is also some great documentation on function and use for the plugin that should be the authority for use.
Leaflet.draw is less of an endpoint, than an enabler of additional functionality. I say this because while it gives us the ability to draw to our hearts content on a map, it also provides the framework to take those drawn objects and push them to a database or similar (which we won’t cover in this overview sorry).
What we will go over though is how to add Leaflet.draw to our simple base map and how to configure some of the wide range of options.
Here’s what we are aiming to show in terms of the range of controls and options on the left hand side of our map.
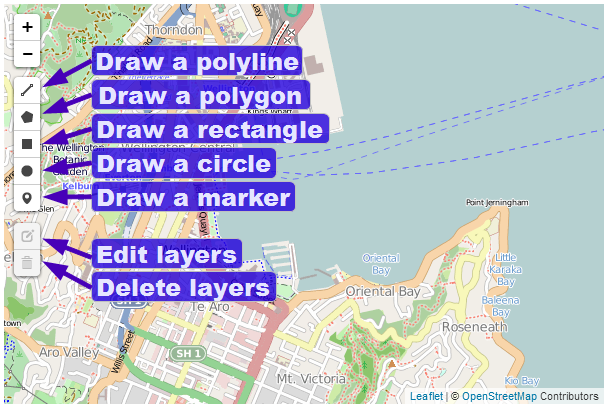
And here’s some example objects produced with the plugin.
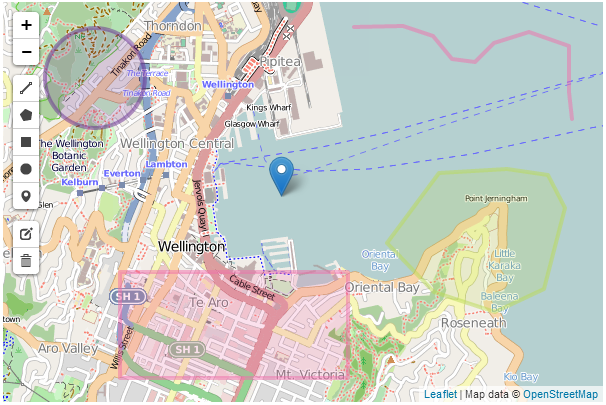
The colours are configurable as we shall see in the coming pages.
Leaflet.draw code description
The following code listing is the bare minimum that should be considered for use with Leaflet.draw. I even hesitate to say that, because the following is really only suitable for demonstrating that you have it running correctly. The configuration options that we will work through in the coming pages will add considerable functionality and will be captured in a separate example that will be available in the Appendices and online on GitHub.
<!DOCTYPE html>
<html>
<head>
<title>Simple Leaflet Map</title>
<meta charset="utf-8" />
<link
rel="stylesheet"
href="http://cdn.leafletjs.com/leaflet-0.7/leaflet.css"
/>
    <link
        rel="stylesheet"
        href="http://leaflet.github.io/Leaflet.draw/leaflet.draw.css"
    />
</head>
<body>
<div id="map" style="width: 600px; height: 400px"></div>
<script
src="http://cdn.leafletjs.com/leaflet-0.7/leaflet.js">
</script>
    <script
        src="http://leaflet.github.io/Leaflet.draw/leaflet.draw.js">
    </script>
<script>
var map = L.map('map').setView([-41.2858, 174.78682], 14);
mapLink =
'<a href="http://openstreetmap.org">OpenStreetMap</a>';
L.tileLayer(
'http://{s}.tile.openstreetmap.org/{z}/{x}/{y}.png', {
attribution: '© ' + mapLink + ' Contributors',
maxZoom: 18,
}).addTo(map);
        var drawnItems = new L.FeatureGroup();
        map.addLayer(drawnItems);

        var drawControl = new L.Control.Draw({
            edit: {
                featureGroup: drawnItems
            }
        });
        map.addControl(drawControl);

        map.on('draw:created', function (e) {
            var type = e.layerType,
                layer = e.layer;
            drawnItems.addLayer(layer);
        });
</script>
</body>
</html>
There are only three ‘blocks’ that have changed in the code from our simple map example.
The first is an additional link to load more CSS code;
<link
rel="stylesheet"
href="http://leaflet.github.io/Leaflet.draw/leaflet.draw.css"
/>
(As with the leaflet.css file which is loaded before hand, I have taken some small formatting liberties to make the code appear more readable on the page.)
This loads the file directly from the Leaflet.draw repository on GitHub, so if you are loading from a local file you will need to adjust the path appropriately.
The second is the block that loads the leaflet.draw.js script.
<script
src="http://leaflet.github.io/Leaflet.draw/leaflet.draw.js">
</script>
Leaflet.draw exists as a separate block of JavaScript code and again, here we are loading the file directly from the Leaflet.draw repository on GitHub (as per the earlier advice, if you are loading from a local file you will need to adjust the path appropriately).
The last change to the file is the block of code that runs and configures Leaflet.draw.
var drawnItems = new L.FeatureGroup();
map.addLayer(drawnItems);
        var drawControl = new L.Control.Draw({
            edit: {
                featureGroup: drawnItems
            }
        });
        map.addControl(drawControl);
        map.on('draw:created', function (e) {
            var type = e.layerType,
                layer = e.layer;
            drawnItems.addLayer(layer);
        });
The var drawnItems = new L.FeatureGroup(); line adds a new extended layer group to the map called drawnItems. This is the layer that the elements we create will be stored on.
Then the map.addLayer(drawnItems); line adds the layer with our drawn items to the map.
Next we get to the first of the true Leaflet.draw commands when we initialize the draw control and pass it the feature group of editable layers;
var drawControl = new L.Control.Draw({
edit: {
featureGroup: drawnItems
}
});
map.addControl(drawControl);
This is required when adding the edit toolbar and tells the Leaflet.draw plugin which layer (drawnItems) should be editable. Then the controls are added to the map (map.addControl(drawControl);).
Finally when we add a new vector or marker we need prompt a trigger that captures the type of item we have created (polyline, rectangle etc) and adds it to the drawn items layer on the map.
map.on('draw:created', function (e) {
var type = e.layerType,
layer = e.layer;
drawnItems.addLayer(layer);
});
This is alto the part of the code where you could store the information that described the element in a database or similar.
Leaflet.draw configuration options
As I mentioned earlier, the sample code described above is extremely cut down and should be extended using the wide range of options available to Leaflet.draw.
Object colours
As our first change, if we use the simple example, all of the elements we generate have the same colour, so lets change that first.
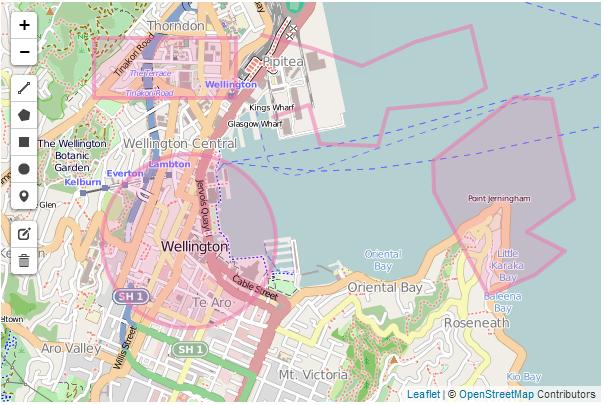
Changing the options is a simple matter of declaring them when we initialize the draw controls by adding them as required by the documentation on the Leaflet.draw GitHub page. For example in the following code snippet we have added in the draw: option which in turn has options for each of the shapes. We have entered the polygon: option which has it’s own options of which we have added shapeOptions: as an option. And as if that wasn’t enough we select the option for color: from this and finally declare it as purple.
        var drawControl = new L.Control.Draw({
			draw: {
				polygon: {
					shapeOptions: {
						color: 'purple'
					},
				},
			},
            edit: {
                featureGroup: drawnItems
            }
        });
        map.addControl(drawControl);
This might seem slightly confusing, but it’s just a simple hierarchy which we can flesh out by doing the same thing for each of the remaining shapes (polyline, rectangle and circle). The code snippet would then look as follows;
		var drawControl = new L.Control.Draw({
			draw: {
				polygon: {
					shapeOptions: {
						color: 'purple'
					},
				},
				polyline: {
					shapeOptions: {
						color: 'red'
					},
				},
				rect: {
					shapeOptions: {
						color: 'green'
					},
				},
				circle: {
					shapeOptions: {
						color: 'steelblue'
					},
				},
			},
			edit: {
				featureGroup: drawnItems
			}
		});
		map.addControl(drawControl);
And our new colours look like this…
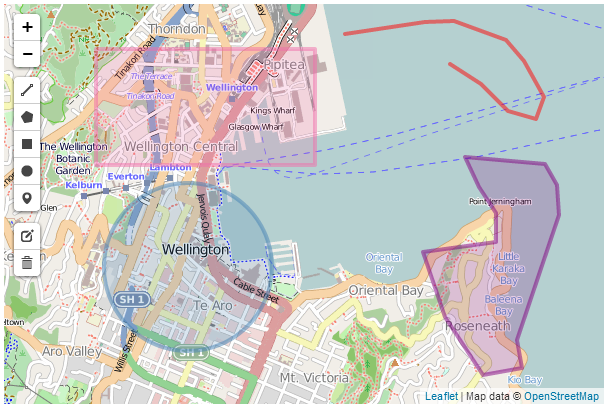
Polygon line intersection
When drawing a polygon it is very easy to cross the lines when describing our object on the screen, and while this may be a desired action, in general it is probably not. However as our code stands, if we tell the script to cross the lines and draw a polygon it will do it with a (perhaps unintended) result looking something like the following…
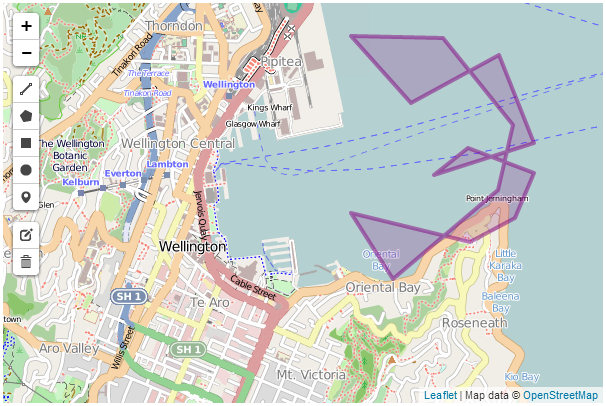
Luckily there is an option that will provide a warning that this is happening while drawing and will allow you to correct and carry on. The following screen shot shows the results when trying to place a point that allows boundary lines to cross;
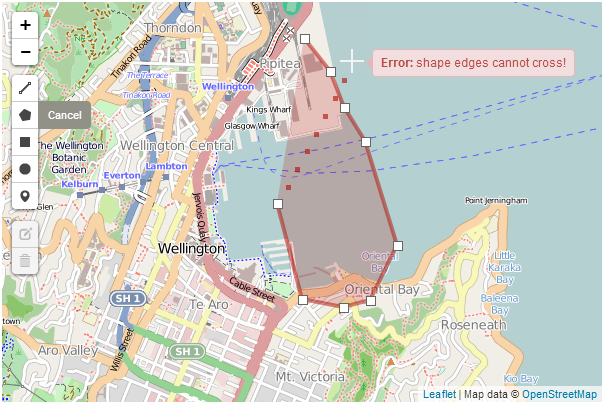
We can see that not only is a warning raised, but the shape colour changes.
This is accomplished by alteration of the polygon options as follows;
				polygon: {
					shapeOptions: {
						color: 'purple'
					},
					allowIntersection: false,
					drawError: {
						color: 'orange',
						timeout: 1000
					},
				},
This has introduced the allowIntersection option and set it to false and provided the drawError option with the instructions to change the colour of the object to orange for 1000 milliseconds.
This option will also work with polyline objects.
Show and measure an area
While tracing a polygon we can get Leaflet.draw to report the total area spanned by the shape by setting the showArea option to true.
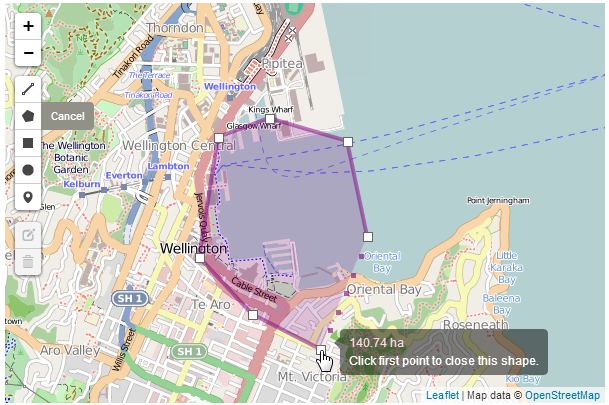
You can see from the screen shot that the area is in hectares, but we can set the measurement units to not be metric (to show acres instead) by setting the metric option to false. The code for the polygon now looks like this;
				polygon: {
					shapeOptions: {
						color: 'purple'
					},
					allowIntersection: false,
					drawError: {
						color: 'orange',
						timeout: 1000
					},
					showArea: true,
					metric: false
				},
Repeating a drawing option automatically
By default once we have finished drawing a polygon, if we wanted to draw another, we would need to click on the polygon tool on the toolbar to start again. But we can use the repeatMode set to true to continue to dray polygons until we select another object to draw or until we press the escape key.
Our polygon option code will now look like this;
				polygon: {
					shapeOptions: {
						color: 'purple'
					},
					allowIntersection: false,
					drawError: {
						color: 'orange',
						timeout: 1000
					},
					showArea: true,
					metric: false,
					repeatMode: true
				},
This option will work with all the other drawing objects.
Place an alternative marker
If an alternative marker has been declared (see section on setting up different markers) it can be specified under the marker option as an alternative icon.
The code to set up an alternative icon duplicates is covered elsewhere, but consists of the following;
		var LeafIcon = L.Icon.extend({
			options: {
				shadowUrl:
				    'http://leafletjs.com/docs/images/leaf-shadow.png',
				iconSize:     [38, 95],
				shadowSize:   [50, 64],
				iconAnchor:   [22, 94],
				shadowAnchor: [4, 62],
				popupAnchor:  [-3, -76]
			}
		});

		var greenIcon = new LeafIcon({
			iconUrl: 'http://leafletjs.com/docs/images/leaf-green.png'
			});
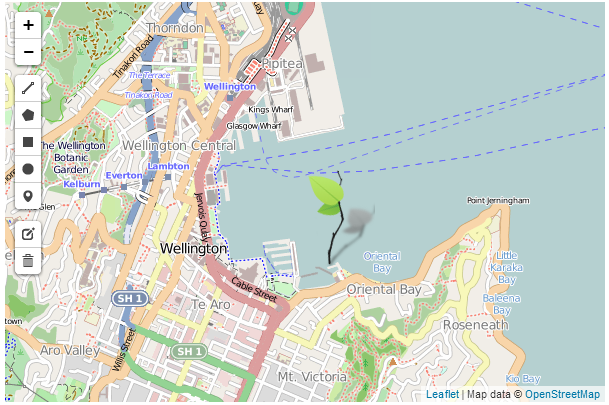
Here we are using one of the markers (the green leaf) set up as part of the custom icons tutorial on GitHub.
And the option code to be added to include an alternative marker is;
				marker: {
					icon: greenIcon
				},
And here’s a pretty picture of the green marker.
Place the Leaflet.draw toolbar in another position
The toolbar position can also be changed. This is configured via an option that is quite high up the hierarchy (in parallel with the draw and edit options). So this should be added directly under the drawControl declaration per the following code snippet;
		var drawControl = new L.Control.Draw({
			position: 'topright',
This will place the toolbar in the top right hand corner of the map as follows;
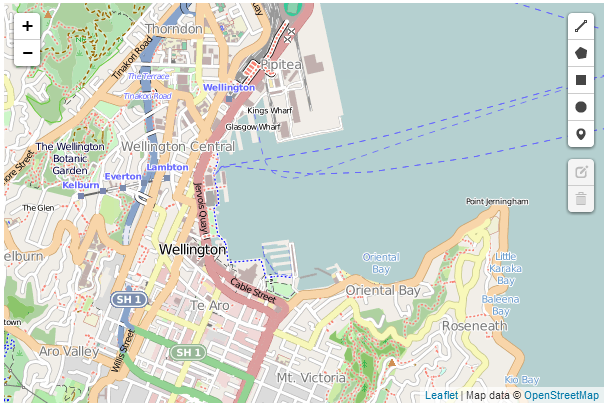
The other options for positioning are bottomright, bottomleft and the default of topleft.
The full code and a live example of the use of the Leaflet.draw plugin with the options described here in the appendices and is available online at bl.ocks.org or GitHub. A copy of all the files that appear in the book can be downloaded (in a zip file) when you download the book from Leanpub.
OSMGeocoder Search
The OSMGeocoder plugin adds a search facility to a leaflet map that uses the OpenStreetMap tool ‘Nominatim’ to search for a location and provide a reverse geolocation on the search term to pinpoint the position on the map.
The plugin was developed by ‘kartenkarsten’ and is hosted on GitHub where it can be downloaded from.
There are a number of configurable options which we shall describe in a moment.
OSMGeocoder code description
The following code is a ‘bare bones’ listing which we will flesh out with some options. The version with the added options will be in the appendices and there will be a link to a live version on bl.ocks.org.
<!DOCTYPE html>
<html>
<head>
<title>osmGeocoder Search Plugin for Leaflet Map</title>
<meta charset="utf-8" />
<link
rel="stylesheet"
href="http://cdn.leafletjs.com/leaflet-0.7/leaflet.css"
/>
<link
rel="stylesheet"
href="http://k4r573n.github.io/leaflet-control-osm-geocoder/Control.OSMGe\
ocoder.css"
/>
</head>
<body>
<div id="map" style="width: 600px; height: 400px"></div>
<script
src="http://cdn.leafletjs.com/leaflet-0.7/leaflet.js">
</script>
<script
src="http://k4r573n.github.io/leaflet-control-osm-geocoder/Control.OSMGeo\
coder.js">
</script>
<script>
var map = L.map('map').setView([-41.2858, 174.78682], 14);
mapLink =
'<a href="http://openstreetmap.org">OpenStreetMap</a>';
L.tileLayer(
'http://{s}.tile.openstreetmap.org/{z}/{x}/{y}.png', {
attribution: '© ' + mapLink + ' Contributors',
maxZoom: 18,
}).addTo(map);
var osmGeocoder = new L.Control.OSMGeocoder();
map.addControl(osmGeocoder);
</script>
</body>
</html>
There are only three ‘blocks’ that have changed in the code from our simple map example.
The first is an additional link to load more CSS code;
<link
    rel="stylesheet"
    href="http://k4r573n.github.io/leaflet-control-osm-geocoder/Control.OSMGeocod\
er.css"
/>
(Because of the length of the URL for the file, the formatting may make cutting and pasting from the ebook problematic. For a more reliable snippet of code, download the live version from GitHub)
This loads the file directly from the OSMGeocoder repository on GitHub, so if you are loading from a local file you will need to adjust the path appropriately.
The second is the block that loads the Control.OSMGeocoder.js script.
<script
    src="http://k4r573n.github.io/leaflet-control-osm-geocoder/Control.OSMGeocode\
r.js">
</script>
(Again because of the length of the URL for the file, the formatting may make cutting and pasting from the ebook problematic. For a more reliable snippet of code, download the live version from GitHub).
Control.OSMGeocoder.js exists as a separate block of JavaScript code and again, here we are loading the file directly from the OSMGeocoder repository on GitHub (as per the earlier advice, if you are loading from a local file you will need to adjust the path appropriately).
The last change to the file is the block of code that runs and configures Leaflet.draw.
        var osmGeocoder = new L.Control.OSMGeocoder();

        map.addControl(osmGeocoder);
The fist line (var osmGeocoder = new L.Control.OSMGeocoder();) initializes the osmGeocoder control and the second (map.addControl(osmGeocoder);) adds the search controls to the map.
There is not a lot of additional code required to get this plugin up and running and the following is what we see on the screen;
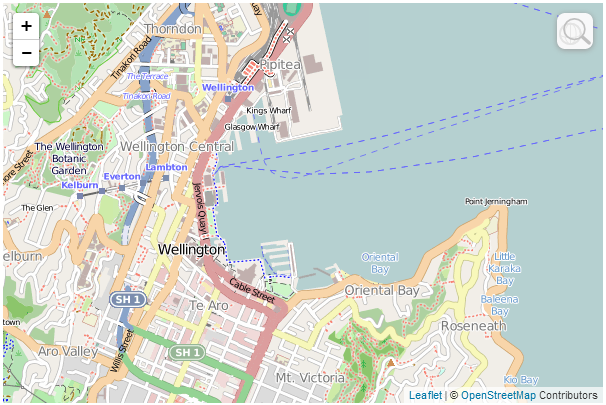
The only noticeable addition is a svelte magnifying glass in the top left hand corner. If we hover our mouse over the magnifying glass a search box appears.

If we then type in an address and click on ‘locate’…

… we are taken to a view of the location of our search.
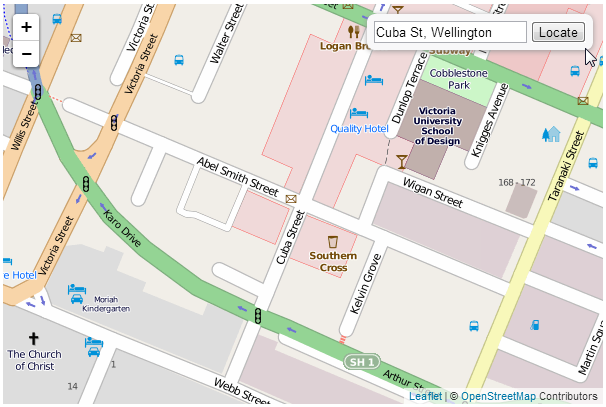
OSMGeocoder configuration options
As I mentioned earlier, the sample code described above is in it’s most basic form and it can be extended using a range of options available to OSMGeocoder.
Adding in options is a simple matter of declaring them when we initialize the OSMGeocoder control. The three options we are going to introduce (there are more, but I’m opting for the simple ones) are to leave the search box up on the screen (no need to hover over the magnifying glass), we will position the search box in the bottom right corner (I’m not advocating this, it’s just for the sake of demonstration) and we will change the text for the button to ‘Find!’. The following are the options added to the OSMGeocoder control that will accomplish this;
        var osmGeocoder = new L.Control.OSMGeocoder({
            collapsed: false,
            position: 'bottomright',
            text: 'Find!',
			});
Resulting in a map that looks a little like this…
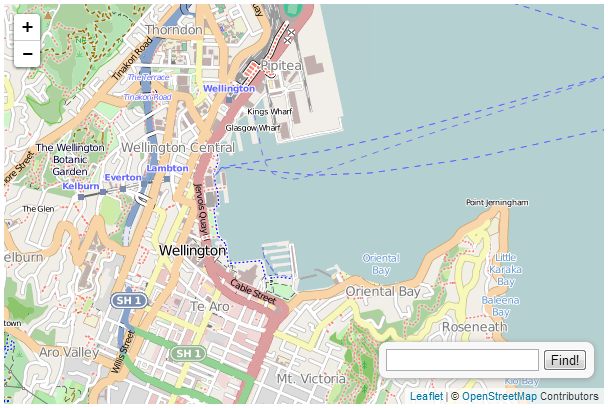
A copy of this file and all the files that appear in the book can be downloaded (in a zip file) when you download the book from Leanpub
Leaflet.FileLayer load local GPX, KML, GeoJSON files
The Leaflet.FileLayer plugin adds the ability to load a gps trace in the form of a KML, GPX or GeoJSON file to a Leaflet map. The idea being that if you have gone on a journey and captured the trip using a gps it can be loaded easily onto a map for viewing.
The plugin was developed by Mathieu Leplatre and is hosted on GitHub where it can be downloaded from.
Leaflet.FileLayer code description
The following is a code listing that we will use to describe the required changes from our simple-map.html example to enable Leaflet.FileLayer. There is also an online version on bl.ocks.org and GitHub.
<!DOCTYPE html>
<html>
<head>
<title>LeafletFileLayer Plugin</title>
<meta charset="utf-8" />
<link
rel="stylesheet"
href="http://cdn.leafletjs.com/leaflet-0.7/leaflet.css"
/>
<link
rel="stylesheet"
href="http://makinacorpus.github.io/Leaflet.FileLayer/Font-Awesome/css/fo\
nt-awesome.min.css"
/>
</head>
<body>
<div id="map" style="width: 600px; height: 400px"></div>
<script
src="http://cdn.leafletjs.com/leaflet-0.7/leaflet.js">
</script>
<script
src="http://makinacorpus.github.io/Leaflet.FileLayer/leaflet.filelayer.js\
">
</script>
<script
src="http://makinacorpus.github.io/Leaflet.FileLayer/togeojson/togeojson.\
js">
</script>
<script>
var map = L.map('map').setView([-41.2858, 174.78682], 14);
mapLink =
'<a href="http://openstreetmap.org">OpenStreetMap</a>';
L.tileLayer(
'http://{s}.tile.openstreetmap.org/{z}/{x}/{y}.png', {
attribution: '© ' + mapLink + ' Contributors',
maxZoom: 18,
}).addTo(map);
var style = {color:'red', opacity: 1.0, fillOpacity: 1.0, weight: 2, clic\
kable: false};
L.Control.FileLayerLoad.LABEL = '<i class="fa fa-folder-open"></i>';
L.Control.fileLayerLoad({
fitBounds: true,
layerOptions: {style: style,
pointToLayer: function (data, latlng) {
return L.circleMarker(latlng, {style: style});
}},
}).addTo(map);
</script>
</body>
</html>
There are three ‘blocks’ that have changed in the code from our simple map example.
The first is an additional link to load more CSS code;
<link
    rel="stylesheet"
    href="http://makinacorpus.github.io/Leaflet.FileLayer/Font-Awesome/css/font-a\
wesome.min.css"
/>
(Because of the length of the URL for the file, the formatting may make cutting and pasting from the ebook problematic. For a more reliable snippet of code, download the live version from GitHub)
This loads the css file directly from the Leaflet.FileLayer repository on GitHub, so if you are loading from a local file you will need to adjust the path appropriately.
The second is the block that loads the leaflet.filelayer.js script and an additional script togeojson.js that was written by Tom MacWright to perform the internal conversion of the GPX and KML traces to GeoJSON.
<script
    src="http://makinacorpus.github.io/Leaflet.FileLayer/leaflet.filelayer.js">
</script>
<script
    src="http://makinacorpus.github.io/Leaflet.FileLayer/togeojson/togeojson.js">
</script>
(Again because of the length of the URL for the file, the formatting may make cutting and pasting from the ebook problematic. For a more reliable snippet of code, download the live version from GitHub).
leaflet.filelayer.js exists as a separate block of JavaScript code and we are loading the file directly from the Leaflet.FileLayer repository on GitHub (as per the earlier advice, if you are loading from a local file you will need to adjust the path appropriately). Likewise we are also loading the togeojson.js file from GitHub.
The last change to the file is the block of code that runs and configures Leaflet.FileLayer.
var style = {color:'red', opacity: 1.0, fillOpacity: 1.0, weight: 2, clickable: f\
alse};
L.Control.FileLayerLoad.LABEL = '<i class="fa fa-folder-open"></i>';
L.Control.fileLayerLoad({
    fitBounds: true,
    layerOptions: {style: style,
                   pointToLayer: function (data, latlng) {
                      return L.circleMarker(latlng, {style: style});
                   }},
}).addTo(map);
The fist line (starting with var style =) sets the styles for the control and the loaded gps traces. Then the icon to initiate the file opening process is declared (L.Control.FileLayerLoad.LABEL = '<i class="fa fa-folder-open"></i>';).
The script then sets the options for Leaflet.FileLayer. The first is the fitBounds option which will present a loaded gps trace in a window that is zoomed to show its full extent. The second is the layerOptions option which will apply the styling to the trace based on our previously declared values (this included the short pointToLayer function that makes circles from point values in the traces).
Lastly we add the layer to our map with .addTo(map).
So when we load our page we can see the folder icon in the top left hand corner.

If we click on this folder we will be presented with a dialogue box where we can select a file to load and when we do…
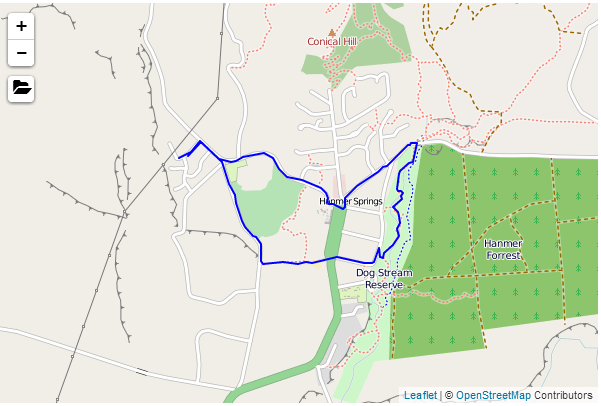
Our gps trace is automatically zoomed and panned to present our trace to its full extent.
A copy of this file and a copy of all the files that appear in the book can be downloaded (in a zip file) when you download the book from Leanpub
Generate a heatmap with Leaflet.heat
A heatmap is a two dimensional representation of values encodes as colours. In our case these colours are superimposed over a map generated using leaflet.js.
The example here represents seismic activity in July / August of 2013 in central New Zealand, when they were unfortunate enough to experience a series of earthquakes.
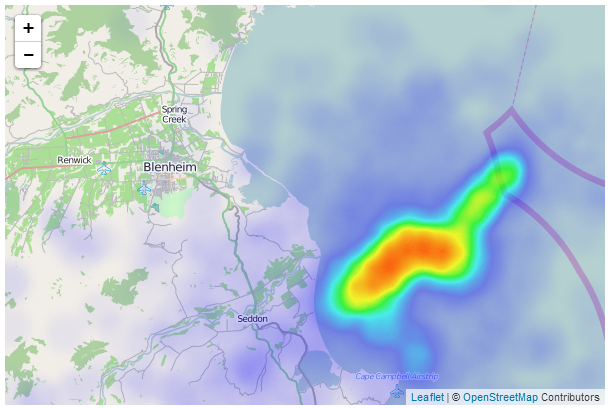
In areas of greater intensity and density, the heatmap produces a gradient that varies from blue to red. This example shows a definite region of increased activity over the time in question.
There are several variations on heatmap plugins for Leaflet. The one we are going to examine is called Leaflet.heat. It is fairly new (at time of writing), and it builds on a separate JavaScript library called simpleheat. Both of these have been developed by Vladimir Agafonkin (yes, the developer of Leaflet), so they come with a considerable pedigree.
Leaflet.heat code description
The following is a code listing that we will use to describe the required changes from our simple-map.html example to enable Leaflet.heat. There is also an online version on bl.ocks.org, GitHub and can be downloaded along with the data file (in a zip file) when you download the book from Leanpub.
<!DOCTYPE html>
<html>
<head>
<title>Simple Leaflet Map with Heatmap </title>
<meta charset="utf-8" />
<link
rel="stylesheet"
href="http://cdn.leafletjs.com/leaflet-0.7/leaflet.css"
/>
</head>
<body>
<div id="map" style="width: 600px; height: 400px"></div>
<script
src="http://cdn.leafletjs.com/leaflet-0.7/leaflet.js">
</script>
    <script
       src="http://leaflet.github.io/Leaflet.heat/dist/leaflet-heat.js">
    </script>
    <script src="2013-earthquake.js"></script>
<script>
var map = L.map('map').setView([-41.5546,174.146], 10);
mapLink =
'<a href="http://openstreetmap.org">OpenStreetMap</a>';
L.tileLayer(
'http://{s}.tile.openstreetmap.org/{z}/{x}/{y}.png', {
attribution: '© ' + mapLink + ' Contributors',
maxZoom: 18,
}).addTo(map);
        var heat = L.heatLayer(quakePoints,{
            radius: 20,
            blur: 15,
            maxZoom: 17,
        }).addTo(map);
</script>
</body>
</html>
We will be loading our data from a separate JavaScript file called 2013-earthquake.js. The data has been sourced from New Zealand’s Geonet site over a date range that covers a period of reasonable seismic activity in July / August 2013.
Loading the file from a separate JavaScript file is purely for conveniences sake and the format of the data is as follows;
There are only two ‘blocks’ that have changed in the code from our simple map example.
The first is an additional two links to external JavaScript files;
<script
src="http://leaflet.github.io/Leaflet.heat/dist/leaflet-heat.js">
</script>
<script src="2013-earthquake.js"></script>
The first link loads the Leaflet.heat plugin and the second loads our data from 2013-earthquake.js.
The second change from our simple map example adds and configures our heatmap layer;
In this block we load the data as the variable quakePoints then set our radius, blur and maxZoom values for the plugin.
radius configuration option
The radius option sets the radius (duh) of the circles that correspond to a single data point on the map. If we remove the blur effect we can clearly see the effect on the map.
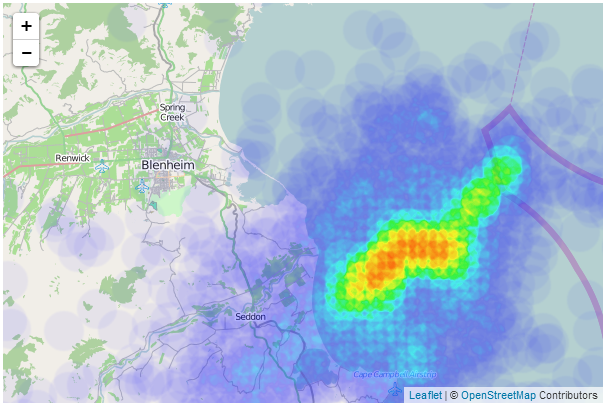
As we zoom in and out of the map, the radii of the points remains constant on the screen, but the representation that they create on the screen changes as there are subsequently more or less points to generate an effect.
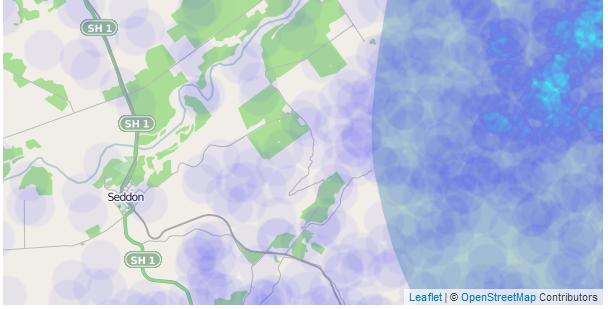
blur configuration option
Blurring the points results in a smoothing and dispersing of the data. The previous section demonstrated the effect of removing the blurring (set to 1), but it can also be increased to the point where they can run the risk of fading away a bit too much. For example this is the effect when blurring is set to 50;
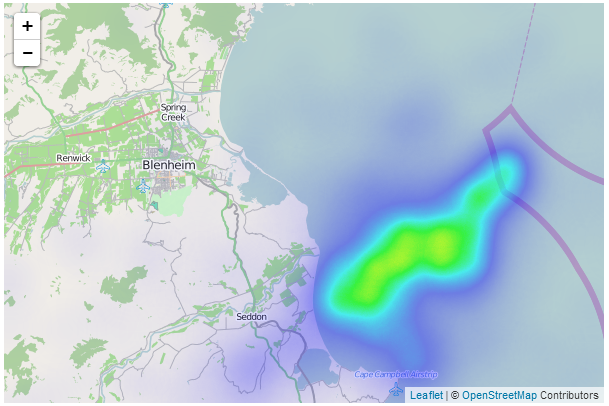
maxZoom configuration option
The maxZoom configuration option designates the level where the points reach their maximum intensity. Therefore if we were to set the maxZoom value to the initial zoom level (10) of our map, we should expect to see each point represented by a full spectrum of blue to green;
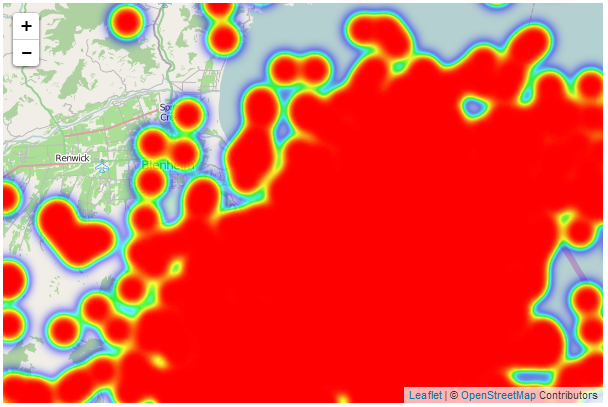
Obviously this is something that you will want to consider as you plan how to set the configuration options on your maps :-).
A copy of this file and a copy of all the files that appear in the book can be downloaded (in a zip file) when you download the book from Leanpub
Assorted Leaflet Tips and Tricks
Make your map full screen
In the simple map example that we developed in the initial chapter we set the size of our map to be 600 pixels wide and 400 pixels high when we were declaring the section of the page (the div with the id map) that would contain the map.
<div id="map" style="width: 600px; height: 400px"></div>
That’s a fine size for embedding somewhere in a page, but There will come a time when you will want to make your map expand to fill the web page.
The astute reader will immediately notice that with our current size declaration using fixed units (pixels) unless all browser windows were the same size we won’t be able to accurately have a map the full size of the web page. It would be too large or too small most of the time.
To remedy this we need to declare a map size that is referenced to the browser, not a fixed unit.
We can do this by declaring our map size as a percentage of the browser window in the <style> section using CSS.
The full code will look like this;
<!DOCTYPE html>
<html>
<head>
<title>Simple Leaflet Map</title>
<meta charset="utf-8" />
<link
rel="stylesheet"
href="http://cdn.leafletjs.com/leaflet-0.7/leaflet.css"
/>
    <style>
        body {
            padding: 0;
            margin: 0;
        }
        html, body, #map {
            height: 100%;
            width: 100%;
        }
    </style>
</head>
<body>
<div id="map"></div>
<script
src="http://cdn.leafletjs.com/leaflet-0.7/leaflet.js">
</script>
<script>
var map = L.map('map').setView([-41.2858, 174.78682], 14);
mapLink =
'<a href="http://openstreetmap.org">OpenStreetMap</a>';
L.tileLayer(
'http://{s}.tile.openstreetmap.org/{z}/{x}/{y}.png', {
attribution: 'Map data © ' + mapLink,
maxZoom: 18,
}).addTo(map);
</script>
</body>
</html>
There are two differences between this example and the simple-map example.
The first is the <style> section;
<style>
body {
padding: 0;
margin: 0;
}
html, body, #map {
height: 100%;
width: 100%;
}
</style>
The body of the page is essentially the entire contents of the web page. You can see in the HTML file that anything that gets drawn on the screen is contained in the <body> tags. So our styling here ensures that there is no padding or margin for our body in the browser and then we set the html, the body and the element with the id map (which we declared in a <div>) to 100 percent of the height and width of the browser.
The only other change we need to make is to remove the fixed size declarations that we had made in the div. So that line ends up looking like this;
<div id="map"></div>
The final result is a map that will fill a browser window no matter what shape you make it.
For example;
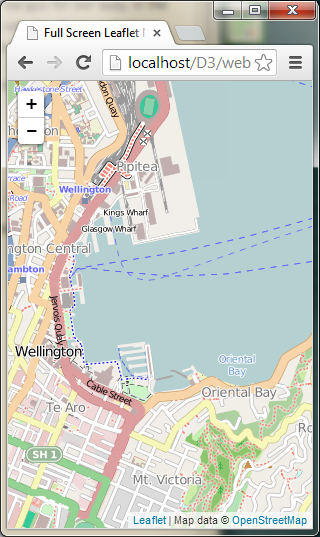
Or even…
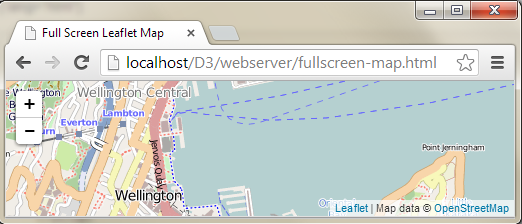
Notice that there are no scroll bars and no borders. The contents of the page fit the browser exactly.
The full code and a live example are available online at bl.ocks.org or GitHub. A a copy of all the files that appear in the book can be downloaded (in a zip file) when you download the book from Leanpub
Importing external data into leaflet.js
While I am not the most experienced person to be giving advice on different ways of importing data into leaflet.js, I have come across a few ways of accomplishing the task which work pretty well and hopefully you will get something out of it too.
Why would you want to do this in the first place?
If we use the example of a simple map that is going to display a line on the map that represents a series of connected coordinates, we are going to have to load the array that represents those coordinates at some point in the script. In the following example we declare our array named planelatlong with a range of data;
<?php ?>
<!DOCTYPE html>
<html>
<head>
<title>Simple Leaflet Map with line</title>
<meta charset="utf-8" />
<link
rel="stylesheet"
href="http://cdn.leafletjs.com/leaflet-0.7/leaflet.css"
/>
</head>
<body>
<div id="map" style="width: 600px; height: 400px"></div>
<script
src="http://cdn.leafletjs.com/leaflet-0.7/leaflet.js">
</script>
<script>
var planelatlong = [
[-41.31825,174.80768],
[-41.31606,174.80774],
[-41.31581,174.80777],
[-41.31115,174.80827],
[-41.30928,174.80835],
[-41.29127,174.83841],
[-41.33571,174.84846],
[-41.34268,174.82877]];
var map = L.map('map').setView([-41.3058, 174.82082], 12);
mapLink =
'<a href="http://openstreetmap.org">OpenStreetMap</a>';
L.tileLayer(
'http://{s}.tile.openstreetmap.org/{z}/{x}/{y}.png', {
attribution: '© ' + mapLink + ' Contributors',
maxZoom: 18,
}).addTo(map);
var polyline = L.polyline(planelatlong).addTo(map);
</script>
</body>
</html>
… and then later in the script we access the data by adding it as a polyline with the line;
var polyline = L.polyline(planelatlong).addTo(map);
The end result is a line on our map that looks like this;
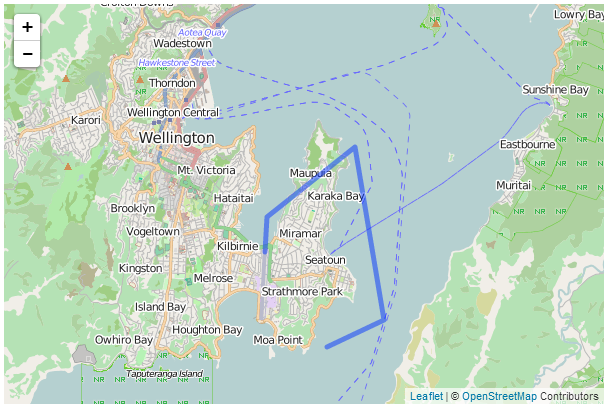
We will look at two ways of loading the data from an outside source. The first is a bit of a cheat in that it still relies on hard coded data in a JavaScript file, but the second is more flexible and allows for the importing of dynamic data from a MySQL database via php.
Importing data as a JavaScript file
As mentioned earlier in the section this technique is more of a cheat than anything since the data is still hard coded in a file somewhere, however, it may provide a degree of flexibility for selecting one of several files depending on different circumstances. We will examine a solution where we simply load a single array of data points (the same one as shown in the previous section).
I describe this technique as cheating because it’s just a matter of adding another JavaScript (.js) file to the web page and loading the data in the added file.
Here is the web page (php file) that will display our map;
<?php ?>
<!DOCTYPE html>
<html>
<head>
<title>Simple Leaflet Map with line</title>
<meta charset="utf-8" />
<link
rel="stylesheet"
href="http://cdn.leafletjs.com/leaflet-0.7/leaflet.css"
/>
</head>
<body>
<div id="map" style="width: 600px; height: 400px"></div>
<script
src="http://cdn.leafletjs.com/leaflet-0.7/leaflet.js">
</script>
    <script
        src="load-js-data.js">
    </script>
<script>
var map = L.map('map').setView([-41.3058, 174.82082], 12);
mapLink =
'<a href="http://openstreetmap.org">OpenStreetMap</a>';
L.tileLayer(
'http://{s}.tile.openstreetmap.org/{z}/{x}/{y}.png', {
attribution: '© ' + mapLink + ' Contributors',
maxZoom: 18,
}).addTo(map);
var polyline = L.polyline(planelatlong).addTo(map);
</script>
</body>
</html>
This is exactly the same as our example from earlier in the section except the declared array (planelatlong) has been replaced by a piece of script that adds in an additional piece of JavaScript code;
<script
src="load-js-data.js">
</script>
The file that is being loaded (load-js-data.js) contains our data. Here it is in full;
	var planelatlong = [
	  [-41.31825,174.80768],
	  [-41.31606,174.80774],
	  [-41.31581,174.80777],
	  [-41.31115,174.80827],
	  [-41.30928,174.80835],
	  [-41.29127,174.83841],
	  [-41.33571,174.84846],
	  [-41.34268,174.82877]];
The best way I have of thinking of this solution is to imagine that it is simply one file that imports part of itself (in this case the data) from another file.
Importing data from MySQL via php
A variant of the explanation to follow is in the MySQL section of this book, But I will explain the steps here in a slightly different way (just in case you’re comparing them).
We’ll start with the assumption that we have created a database and populated it with information. Now we need to work out how to extract a subset of that information and how to do it in a format that is valid (won’t cause an error) JavaScript.
What we’re going to do is to achieve the same result that we attained in the previous section where we used a line in the main web file to pull in the data in the format that we want.
To recap, we want to have the following array declaration imported from an external source;
	var planelatlong = [
	  [-41.31825,174.80768],
	  [-41.31606,174.80774],
	  [-41.31581,174.80777],
	  [-41.31115,174.80827],
	  [-41.30928,174.80835],
	  [-41.29127,174.83841],
	  [-41.33571,174.84846],
	  [-41.34268,174.82877]];
In this example we are going to run a php script in the position where that data would normally be placed and the php script will import the array declaration. Our web file looks almost exactly the same as our ‘import with a JavaScript file’ effort from the previous section, but in this case the importing line is different;
<?php ?>
<!DOCTYPE html>
<html>
<head>
<title>Simple Leaflet Map</title>
<meta charset="utf-8" />
<link
rel="stylesheet"
href="http://cdn.leafletjs.com/leaflet-0.7/leaflet.css"
/>
</head>
<body>
<div id="map" style="width: 600px; height: 400px"></div>
<script
src="http://cdn.leafletjs.com/leaflet-0.7/leaflet.js">
</script>
<script>
<?php include 'planelatlong.php'; ?>
var map = L.map('map').setView([-41.3058, 174.82082], 12);
mapLink =
'<a href="http://openstreetmap.org">OpenStreetMap</a>';
L.tileLayer(
'http://{s}.tile.openstreetmap.org/{z}/{x}/{y}.png', {
attribution: '© ' + mapLink + ' Contributors',
maxZoom: 18,
}).addTo(map);
var polyline = L.polyline(planelatlong).addTo(map);
</script>
</body>
</html>
Hopefully you can see it there in the middle. It is the following line;
<?php include 'planelatlong.php'; ?>When the web file gets to that line it will run the script planelatlong.php and that script will import our declared data array.
Extracting data from MySQL with php
Our php script is going to exist as a separate file which we will name planelatlong.php (ideally we would place this in a separate directory called php which will be in our web’s root directory (alongside the data directory) but for the sake of simplicity we will have our ‘calling’ file (the one with the leaflet.js script) and this php script in the same directory).
The database that we’re going to access is one that contains a range of values. Two of which are the latitude and longitude of a plane in flight. The database is organised as follows;
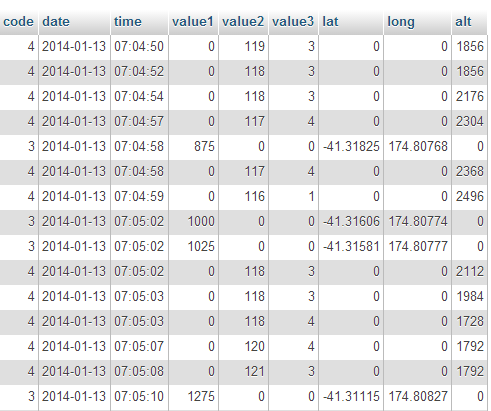
In our example we will pull out only the rows with the latitude and longitude and return only them in a format that the script will recognise as follows;
	var planelatlong = [
	  [-41.31825,174.80768],
	  [-41.31606,174.80774],
	  [-41.31581,174.80777],
	  [-41.31115,174.80827],
	  [-41.30928,174.80835],
	  [-41.29127,174.83841],
	  [-41.33571,174.84846],
	  [-41.34268,174.82877]];
Here’s the contents of our planelatlong.php file (This is also available in electronic form in the zip file of example scripts that can be downloaded when you download the book from Leanpub);
<?php
    $username = "planeuser";
    $password = "planeuser";
    $host = "localhost";
    $database="planedb";

    $server = mysql_connect($host, $username, $password);
    $connection = mysql_select_db($database, $server);

    $myquery = "
SELECT  `lat`, `long` FROM  `test01`
WHERE `lat` <> 0
";
    $query = mysql_query($myquery);

    if ( ! $query ) {
        echo mysql_error();
        die;
    }

    $data = array();

	echo "var planelatlong = [";

    for ($x = 0; $x < mysql_num_rows($query); $x++) {
        $data[] = mysql_fetch_assoc($query);
        echo "[",$data[$x]['lat'],",",$data[$x]['long'],"]";
        if ($x <= (mysql_num_rows($query)-2) ) {
			echo ",";
		}
    }

    	echo "];";

    mysql_close($server);
?>
It’s pretty short, but it packs a punch. Let’s go through it and see what it does.
The <?php line at the start and the ?> line at the end form the wrappers that allow the requesting page to recognise the contents as php and to execute the code rather than downloading it for display.
The following lines set up a range of important variables;
    $username = "planeuser";
    $password = "planeuser";
    $host = "localhost";
    $database="planedb";
These are configuration details for the MySQL database. There’s user and password (don’t worry, because the script isn’t returned to the browser, the browser doesn’t get to see the password). There’s the host location of our database (in this case it’s local, but if it was on a remote server, we would just include its address) and there’s the database we’re going to access.
Then we use those variables to connect to the server…
$server = mysql_connect($host, $username, $password);
… and then we connect to the specific database;
$connection = mysql_select_db($database, $server);
Then we have our query in a form that we can paste into the right spot and it’s easy to use.
    $myquery = "
SELECT  `lat`, `long` FROM  `test01`
WHERE `lat` <> 0
";
I have it like this so all I need to do to change the query I use is to paste it into the middle line there between the speech-marks and I’m done. It’s just a convenience thing.
The query itself is a fairly simple affair. We return lat and long from our table called test01 but only if the lat value on the row is not equal to zero (WHERE lat <> 0) (this will allow us to ignore the rows which do not contain a latitude (and typically a longitude in this case) value.
The query is then run against the database with the following command;
$query = mysql_query($myquery);
…and then we check to see if it was successful. If it wasn’t, we output the MySQL error code;
    if ( ! $query ) {
        echo mysql_error();
        die;
    }
Then we declare the $data variable as an array;
$data = array();
Now we begin to echo, or print out the values for our piece of code that we expect to have inserted into our leaflet.js code;
First of all we print out the start of the declaration of our array;
echo "var planelatlong = [";
Then we start up a for loop that goes from 0 ($x = 0;) to the number of returned rows in our query ($x < mysql_num_rows($query)) one step at a time ($x++)
for ($x = 0; $x < mysql_num_rows($query); $x++) {
We place our rows into our $data array…
$data[] = mysql_fetch_assoc($query);
… and then echo each row as a latitude and longitude value enclosed by square brackets and separated by a comma;
echo "[",$data[$x]['lat'],",",$data[$x]['long'],"]";
So that each line looks a little like this
[-41.31825,174.80768]
Because we need to separate our lat/long values that are enclosed with brackets from each other with a comma like this…
	[-41.31825,174.80768],
	[-41.31606,174.80774]
… but we don’t want a comma after the last lat/long pair. We can use an if statement to evaluate each row to see if it’s the last and print a comma if its not;
        if ($x <= (mysql_num_rows($query)-2) ) {
			echo ",";
		}
After the our rows have finished being produced by our loop we need to close it off with another square bracket;
echo "];";
And all that remains is to close the connection to our MySQL database;
mysql_close($server);
That’s it.
We can actually test the script directly by opening the file in our browser.
If you navigate using your browser to this file and click on it to run it (WAMP should be your friend here again) this is what you should see printed out on your screen (at least the information, but probably not formatted as nicely);
	var planelatlong = [
	  [-41.31825,174.80768],
	  [-41.31606,174.80774],
	  [-41.31581,174.80777],
	  [-41.31115,174.80827],
	  [-41.30928,174.80835],
	  [-41.29127,174.83841],
	  [-41.33571,174.84846],
	  [-41.34268,174.82877]];
There it is! A nicely declared array of latitude / longitude points!
It looks a bit unusual on the printed page, but it’s bread and butter for JavaScript.
I have included the planelatlong.php file with the files available when you download the Leaflet Tips and Tricks book.
To reiterate, our main web page file that is presenting our map gets to the point in its script where it is going to get the data. At this point it calls a script called planelatlong.php and this script gets the data from a MySQL database, formats it properly and includes it in the web page’s JavaScript.
It is a slightly complex concept if you’re a beginner to the world of databases and php scripts, but if you persevere and get it working, the understanding of what you will have achieved is worth its weight in gold.
Making maps with d3.js and leaflet.js combined
If you’ve read to this point in Leaflet Tips and Tricks, you may be aware that I have also written another book called ‘D3 Tips and Tricks’. I haven’t written both books because they are integrated with each other or because they seem made to compliment each other. I wrote them because both libraries are the best of breed (IMHO) at what they do. It should come as little surprise that they can have a lot to offer users who want to combine the incredible scope of d3.js’s data manipulation functions and the elegance of leaflet.js’s tile map presentation capabilities.
d3.js Overview
d3.js is “a JavaScript library for manipulating documents based on data”.
D3 is all about helping you to take information and make it more accessible to others via a web browser.
It’s a JavaScript library implemented as an open framework built to leverage web standards that allows you to associate data and what appears on the screen in a way that directly links the two. Change the data and you change the object on the screen.
It was (and still is being) developed by Mike Bostock who has not just spent time writing the code, but writing the documentation for D3 as well. There is an extensive community of supporters who also contribute to the code, provide technical support online and generally have fun creating amazing visualizations.
Why use d3.js when leaflet.js can include objects on maps too?
Good question. I can see you’ve been paying attention.
There is a difference in the scope of flexibility between how d3.js and leaflet.js can manipulate added objects (think markers and ploygons). D3.js predominantly focusses on vector based graphics when drawing maps and leaflet.js leverages the huge range of bitmap based map tiles that are available for use around the world. Both bitmap and vector based solutions have strengths and weaknesses depending on the application. Combining both allows the use of the best of both worlds.
Leaflet map with d3.js objects that scale with the map
The first example we’ll look at will project a leaflet.js map on the screen with a d3.js object (in this case a simple rectangle) onto the map.
The rectangle will be bound to a set of geographic coordinates so that as the map is panned and zoomed the rectangle will shrink and grow. For example the following diagram shows a rectangle (made with d3.js ) superimposed over a leaflet.js map;
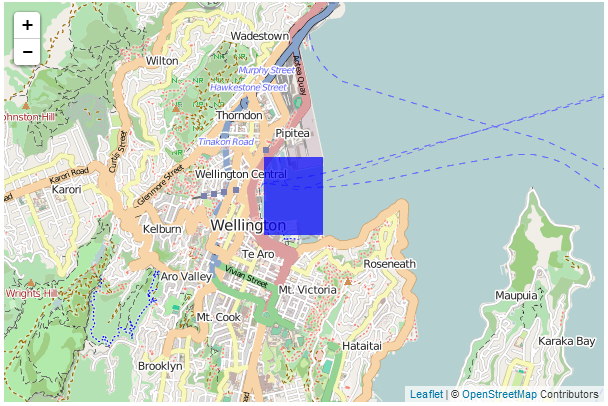
If we then zoom in…
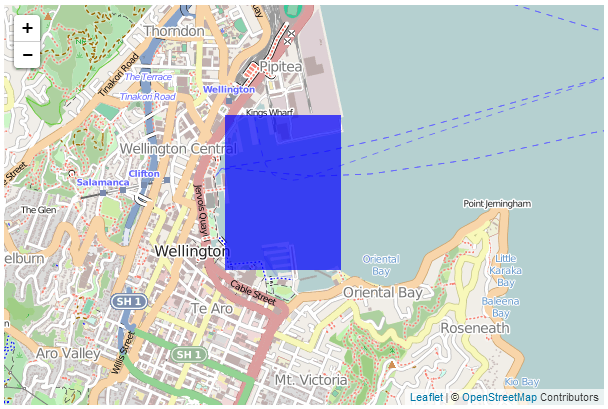
…the rectangle zooms in as well.
For an excellent example of this please visit Mike Bostock’s tutorial where he demonstrates superimposing a map of the United States separated by state (which react individually to the mouse being hovered over them). My following explanation is a humble derivation of his code.
Speaking of code, here is a full listing of the code that we will be using;
<!DOCTYPE html>
<html>
<head>
    <title>Leaflet and D3 Map</title>
    <meta charset="utf-8" />
    <link
        rel="stylesheet"
        href="http://cdn.leafletjs.com/leaflet-0.7/leaflet.css"
    />

</head>
<body>

    <div id="map" style="width: 600px; height: 400px"></div>

	<script src="http://d3js.org/d3.v3.min.js"></script>

    <script
        src="http://cdn.leafletjs.com/leaflet-0.7/leaflet.js">
    </script>
<script>
var map = L.map('map').setView([-41.2858, 174.7868], 13);
mapLink =
'<a href="http://openstreetmap.org">OpenStreetMap</a>';
L.tileLayer(
'http://{s}.tile.openstreetmap.org/{z}/{x}/{y}.png', {
attribution: '© ' + mapLink + ' Contributors',
maxZoom: 18,
}).addTo(map);
// Add an SVG element to Leaflet’s overlay pane
var svg = d3.select(map.getPanes().overlayPane).append("svg"),
	g = svg.append("g").attr("class", "leaflet-zoom-hide");
d3.json("rectangle.json", function(geoShape) {
// create a d3.geo.path to convert GeoJSON to SVG
var transform = d3.geo.transform({point: projectPoint}),
	path = d3.geo.path().projection(transform);
// create path elements for each of the features
d3_features = g.selectAll("path")
.data(geoShape.features)
.enter().append("path");
map.on("viewreset", reset);
reset();
// fit the SVG element to leaflet's map layer
function reset() {
bounds = path.bounds(geoShape);
var topLeft = bounds[0],
bottomRight = bounds[1];
svg .attr("width", bottomRight[0] - topLeft[0])
.attr("height", bottomRight[1] - topLeft[1])
.style("left", topLeft[0] + "px")
.style("top", topLeft[1] + "px");
g .attr("transform", "translate(" + -topLeft[0] + ","
+ -topLeft[1] + ")");
// initialize the path data
d3_features.attr("d", path)
.style("fill-opacity", 0.7)
.attr('fill','blue');
}
// Use Leaflet to implement a D3 geometric transformation.
function projectPoint(x, y) {
	var point = map.latLngToLayerPoint(new L.LatLng(y, x));
	this.stream.point(point.x, point.y);
}
})
</script>
</body>
</html>
There is also an associated json data file (called rectangle.json) that has the following contents;
The full code and a live example are available online at bl.ocks.org or GitHub. They are also available as the files ‘leaflet-d3-combined.html’ and ‘rectangle.json’ as a separate download with Leaflet Tips and Tricks. A a copy of all the files that appear in the book can be downloaded (in a zip file) when you download the book from Leanpub
While I will explain the code below, please be aware that I will gloss over some of the simpler sections that are covered in other sections of either books and will instead focus on the portions that are important to understand the combination of D3 and Leaflet.
Our code begins by setting up the html document in a fairly standard way.
<!DOCTYPE html>
<html>
<head>
<title>Leaflet and D3 Map</title>
<meta charset="utf-8" />
<link
rel="stylesheet"
href="http://cdn.leafletjs.com/leaflet-0.7/leaflet.css"
/>
</head>
<body>
<div id="map" style="width: 600px; height: 400px"></div>
<script src="http://d3js.org/d3.v3.min.js"></script>
<script
src="http://cdn.leafletjs.com/leaflet-0.7/leaflet.js">
</script>
Here we’re getting some css styling and loading our leaflet.js / d3.js libraries. The only configuration item is where we set up the size of the map (in the <style> section and as part of the map div).
Then we break into the JavaScript code. The first thing we do is to project our Leaflet map;
var map = L.map('map').setView([-41.2858, 174.7868], 13);
mapLink =
'<a href="http://openstreetmap.org">OpenStreetMap</a>';
L.tileLayer(
'http://{s}.tile.openstreetmap.org/{z}/{x}/{y}.png', {
attribution: '© ' + mapLink + ' Contributors',
maxZoom: 18,
}).addTo(map);
This is exactly the same as we have done in any of the simple map explanations in Leaflet Tips and Tricks and in this case we are using the OpenStreetMap tiles.
Then we start on the d3.js part of the code.
The first part of that involves making sure that Leaflet and D3 are synchronised in the view that they’re projecting. This synchronisation needs to occur in zooming and panning so we add an SVG element to Leaflet’s overlayPlane
var svg = d3.select(map.getPanes().overlayPane).append("svg"),
g = svg.append("g").attr("class", "leaflet-zoom-hide");
Then we add a g element that ensures that the SVG element and the Leaflet layer have the same common point of reference. Otherwise when they zoomed and panned it could be offset. The leaflet-zoom-hide affects the presentation of the map when zooming. Without it the underlying map zooms to a new size, but the d3.js elements remain as they are until the zoom effect has taken place and then they adjust. It still works fine, but it ‘looks’ odd.
Then we load our data file with the line…
d3.json("rectangle.json", function(geoShape) {
This is pretty standard fare for d3.js but it’s worth being mindful that while the type of data file is .json this is a GeoJSON file and they have particular features (literally) that allow them to do their magic. There is a good explanation of how they are structured at geojson.org for those who are unfamiliar with the differences.
Using our data we need to ensure that it is correctly transformed from our latitude/longitude coordinates as supplied to coordinates on the screen. We do this by implementing d3’s geographic transformation features (d3.geo).
var transform = d3.geo.transform({point: projectPoint}),
path = d3.geo.path().projection(transform);
Here the path that we want to create in SVG is generated from the points that are supplied from the data file which are converted by the function projectPoint This function (which is placed at the end of the file) takes our latitude and longitudes and transforms them to screen (layer) coordinates.
function projectPoint(x, y) {
var point = map.latLngToLayerPoint(new L.LatLng(y, x));
this.stream.point(point.x, point.y);
}
With the transformations now all taken care of we can generate our path in the traditional d3.js way and append it to our g group.
d3_features = g.selectAll("path")
	.data(geoShape.features)
	.enter().append("path");
The last ‘main’ part of our JavaScript makes sure that when our view of what we’re looking at changes (we zoom or pan) that our d3 elements change as well;
	map.on("viewreset", reset);

	reset();
Obviously when our view changes we call the function reset. It’s the job of the reset function to ensure that whatever the leaflet layer does, the SVG (d3.js) layer follows;
function reset() {

	bounds = path.bounds(geoShape);

	var topLeft = bounds[0],
		bottomRight = bounds[1];

	svg .attr("width", bottomRight[0] - topLeft[0])
		.attr("height", bottomRight[1] - topLeft[1])
		.style("left", topLeft[0] + "px")
		.style("top", topLeft[1] + "px");

	g .attr("transform", "translate(" + -topLeft[0] + ","
									  + -topLeft[1] + ")");

	// initialize the path data
	d3_features.attr("d", path)
		.style("fill-opacity", 0.7)
		.attr('fill','blue');
}
It does this by establishing the topLeft and bottomRightcorners of the desired area and then it applies the width, height, top and bottom attributes to the svg element and translates the g element to the right spot. Last, but not least it redraws the path.
The end result being a fine combination of leaflet.js map and ds.js element;

Leaflet map with d3.js elements that are overlaid on a map
The next example of a combination of d3.js and leaflet.js is one where we want to have an element overlaid on our map at a specific location, but have it remain a specific size over the map. For example, here we will display 5 circles which are centred at specific geographic locations.
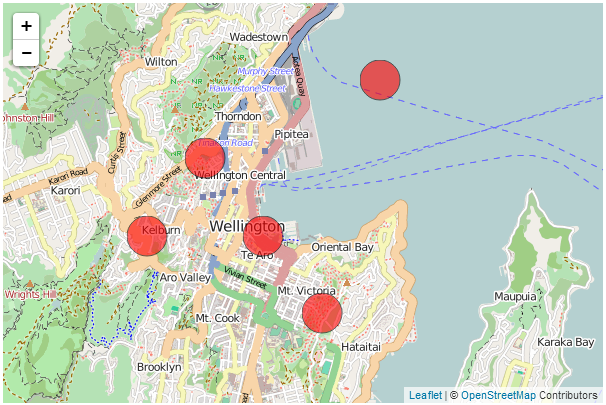
When we zoom out of the map, those circles remain over the geographic location, but the same size on the screen.
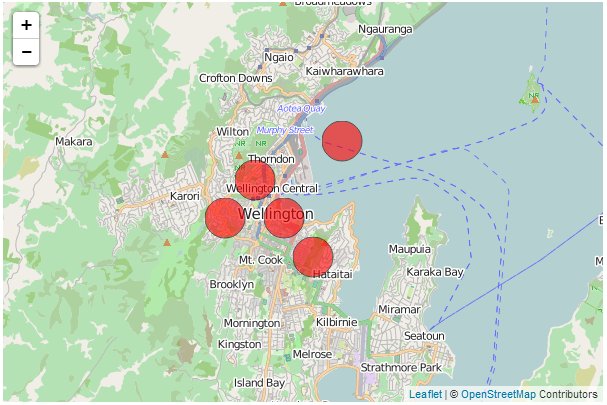
You may (justifiably) ask yourself why we would want to do this with d3.js when Leaflet could do the same job with a marker? The answer is that as cool as leaflet.js’s markers are, d3 elements have a wider range of features that make their use advantageous in some situations. For instance if you want to animate or rotate the icons or dynamically adjust some of their attributes, d3.js would have a greater scope for adjustments.
The following code draws circles at geographic locations;
<!DOCTYPE html>
<html>
<head>
	<title>d3.js with leaflet.js</title>

    <link
        rel="stylesheet"
        href="http://cdn.leafletjs.com/leaflet-0.7/leaflet.css"
    />
    <script src="http://d3js.org/d3.v3.min.js"></script>

    <script
        src="http://cdn.leafletjs.com/leaflet-0.7/leaflet.js">
    </script>

</head>
<body>

	<div id="map" style="width: 600px; height: 400px"></div>
<script type="text/javascript">
var map = L.map('map').setView([-41.2858, 174.7868], 13);
mapLink =
'<a href="http://openstreetmap.org">OpenStreetMap</a>';
L.tileLayer(
'http://{s}.tile.openstreetmap.org/{z}/{x}/{y}.png', {
attribution: '© ' + mapLink + ' Contributors',
maxZoom: 18,
}).addTo(map);
	// Initialize the SVG layer
	map._initPathRoot()

	// We pick up the SVG from the map object
	var svg = d3.select("#map").select("svg"),
	g = svg.append("g");
d3.json("circles.json", function(collection) {
// Add a LatLng object to each item in the dataset
	collection.objects.forEach(function(d) {
        d.LatLng = new L.LatLng(d.circle.coordinates[0],
                                d.circle.coordinates[1])
	})
		var feature = g.selectAll("circle")
			.data(collection.objects)
			.enter().append("circle")
			.style("stroke", "black")
			.style("opacity", .6)
			.style("fill", "red")
			.attr("r", 20);
		map.on("viewreset", update);
		update();
	function update() {
		feature.attr("transform",
		function(d) {
			return "translate("+
				map.latLngToLayerPoint(d.LatLng).x +","+
				map.latLngToLayerPoint(d.LatLng).y +")";
			}
		)
	}
})
</script>
</body>
</html>
There is also an associated json data file (called circles.json) that has the following contents;
The full code and a live example are available online at bl.ocks.org or GitHub. They are also available as the files ‘leaflet-d3-linked.html’ and ‘circles.json’ as a separate download with Leaflet Tips and Tricks. A a copy of all the files that appear in the book can be downloaded (in a zip file) when you download the book from Leanpub
While I will explain the code below, as with the previous example (which is similar, but different) please be aware that I will gloss over some of the simpler sections that are covered in other sections of either books and will instead focus on the portions that are important to understand the combination of D3 and Leaflet.
Our code begins by setting up the html document in a fairly standard way.
<!DOCTYPE html>
<html>
<head>
<title>d3.js with leaflet.js</title>
<link
rel="stylesheet"
href="http://cdn.leafletjs.com/leaflet-0.7/leaflet.css"
/>
<script src="http://d3js.org/d3.v3.min.js"></script>
<script
src="http://cdn.leafletjs.com/leaflet-0.7/leaflet.js">
</script>
</head>
<body>
<div id="map" style="width: 600px; height: 400px"></div>
Here we’re getting some css styling and loading our leaflet.js / d3.js libraries. The only configuration item is where we set up the size of the map (in the <div> section and as part of the map div).
Then we break into the JavaScript code. The first thing we do is to project our Leaflet map;
var map = L.map('map').setView([-41.2858, 174.7868], 13);
mapLink =
'<a href="http://openstreetmap.org">OpenStreetMap</a>';
L.tileLayer(
'http://{s}.tile.openstreetmap.org/{z}/{x}/{y}.png', {
attribution: '© ' + mapLink + ' Contributors',
maxZoom: 18,
}).addTo(map);
This is exactly the same as we have done in any of the simple map explanations in Leaflet Tips and Tricks and in this case we are using the OpenStreetMap tiles.
Then we start on the d3.js part of the code.
Firstly the Leaflet map is initiated as SVG using map._initPathRoot().
// Initialize the SVG layer
map._initPathRoot()
// We pick up the SVG from the map object
var svg = d3.select("#map").select("svg"),
g = svg.append("g");
Then we select the svg layer and append a g element to give a common reference point g = svg.append("g").
Then we load the json file with the coordinates for the circles;
d3.json("circles.json", function(collection) {
Then for each of the coordinates in the objects section of the json data we declare a new latitude / longitude pair from the associated coordinates;
collection.objects.forEach(function(d) {
d.LatLng = new L.LatLng(d.circle.coordinates[0],
d.circle.coordinates[1])
})
Then we use a simple d3.js routine to add and place our circles based on the coordinates of each of our objects.
var feature = g.selectAll("circle")
.data(collection.objects)
.enter().append("circle")
.style("stroke", "black")
.style("opacity", .6)
.style("fill", "red")
.attr("r", 20);
We declare each as a feature and add a bit of styling just to make them stand out.
The last ‘main’ part of our JavaScript makes sure that when our view of what we’re looking at changes (we zoom or pan) that our d3 elements change as well;
map.on("viewreset", update);
update();
Obviously when our view changes we call the function update. It’s the job of the update function to ensure that whenever the leaflet layer moves, the SVG layer with the d3.js elements follows and the points that designate the locations of those objects move appropriately;
function update() {
feature.attr("transform",
function(d) {
return "translate("+
map.latLngToLayerPoint(d.LatLng).x +","+
map.latLngToLayerPoint(d.LatLng).y +")";
}
)
}
Here we are using the transform function on each feature to adjust the coordinates on our LatLng coordinates. We only need to adjust our coordinates since the size, shape, rotation and any other attribute or style is dictated by the objects themselves.
And there we have it!

Tile servers that can be used with Leaflet
A tile server is a source of the tiles that leaflet.js uses to present a map. Because there are many unique requirements for maps there are a large number of variations of tile servers that apply different formatting and styling to the geographic information.
In this chapter we will present the different services available and the different requirements for use in terms of the URL template, terms of use and attribution where appropriate.
URL Template
The URL template is the format required when specifying the link to the tiles on the server. Typically this will be in the form of a server name (which may have sub-domains) followed by the zoom level and then x/y values for the tiles. For example, the following is the URL template for the standard OSM server.
The http://{s}.tile.openstreetmap.org is the server name with the {s} part representing a variation in possible sub-domains. {z} is the zoom level and {x}/{y} is the tile location.
Usage Policy
Because there is an overhead involved in generating and providing tiles to make maps with, it is expected (and entirely reasonable) that providers will have a usage policy to avoid placing an undue strain on their equipment and bandwidth.
Attribution
Attribution is about providing credit where credit is due and acknowledging the copyright of the originator of a work. It is significant effort to style and produce map tiles and that should be recognised and noted appropriately. Typically this would be in the form of a note in the bottom right hand corner of the map being presented. Some of the attribution requirements might sound a little formal, but they need to be that way so that their message is clear in a legal sense. To ordinary people, we need to recognise that we are using a work created by someone else and that we make sure we recognise that appropriately :-).
Open Street Map OSM Mapnik
This is the standard tile server in use for Open Street Map.
URL Template
Usage policy
The best place to view the detail on the usage policy for Open Street Maps tiles is from their tile usage policy wiki page. The main concern with usage is the load placed on their resources which are finite considering their position as a volunteer run service. So be gentle and when in doubt, check out the wiki.
Attribution
Open Street Map provides open data, licensed under the Open Data Commons Open Database License (ODbL). The cartography in their map tiles is licensed under the Creative Commons Attribution-ShareAlike 2.0 license (CC BY-SA). They require that you use the credit “© OpenStreetMap contributors” and that the cartography is licensed as CC BY-SA. You may do this by linking to the copyright page at http://www.openstreetmap.org/copyright.
Usage example
mapLink =
'<a href="http://openstreetmap.org">OpenStreetMap</a>';
L.tileLayer(
'http://{s}.tile.openstreetmap.org/{z}/{x}/{y}.png', {
attribution: '© ' + mapLink + ' Contributors',
maxZoom: 18,
}).addTo(map);
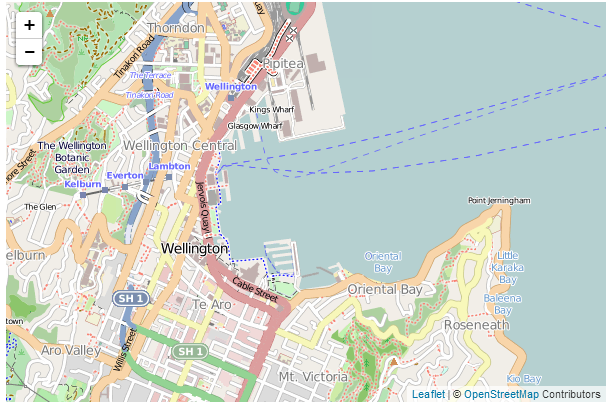
Open Street Map Black and White
This is variation on the standard tile server in use for Open Street Map but in black and white / grey-scale.
URL Template
Usage policy
The best place to view the detail on the usage policy for Open Street Maps tiles is from their tile usage policy wiki page. The main concern with usage is the load placed on their resources which are finite considering their position as a volunteer run service. So be gentle and when in doubt, check out the wiki.
Attribution
Open Street Map provides open data, licensed under the Open Data Commons Open Database License (ODbL). The cartography in their map tiles is licensed under the Creative Commons Attribution-ShareAlike 2.0 license (CC BY-SA). They require that you use the credit “© OpenStreetMap contributors” and that the cartography is licensed as CC BY-SA. You may do this by linking to the copyright page at http://www.openstreetmap.org/copyright.
Usage example
mapLink =
'<a href="http://openstreetmap.org">OpenStreetMap</a>';
L.tileLayer(
'http://{s}.www.toolserver.org/tiles/bw-mapnik/{z}/{x}/{y}.png', {
attribution: '© ' + mapLink + ' Contributors',
maxZoom: 18,
}).addTo(map);
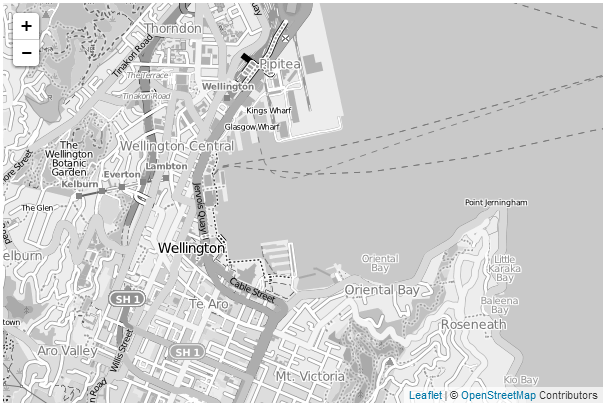
Open Cycle Map
OpenCycleMap is a global map for cyclists, based on data from the OpenStreetMap project. At low zoom levels it is intended for overviews of national cycling networks; at higher zoom levels it should help with planning which streets to cycle on, where you can park your bike and so on. The maps are provided by Thunderforest who also provide other mapping options as well. Additional documentation on OpenCycle Map can be found on their documentation page.
URL Template
Usage policy
There are some simple guidelines on the Thunderforest terms and conditions page. The main concern with usage is the load placed on resources. So be gentle.
Attribution
Thunderforest provides open data, under a Creative Commons licence, specifically CC-BY-SA 2.0. The full details are available on their terms and conditions page. Attribution must be given to both “Thunderforest” and “OpenStreetMap contributors”. Users of your map must have a working link to www.thunderforest.com.
Usage example
mapLink = '<a href="http://openstreetmap.org">OpenStreetMap</a>';
ocmlink = '<a href="http://thunderforest.com/">Thunderforest</a>';
L.tileLayer(
'http://{s}.tile.thunderforest.com/cycle/{z}/{x}/{y}.png', {
attribution: '© '+mapLink+' Contributors & '+ocmlink,
maxZoom: 18,
}).addTo(map);
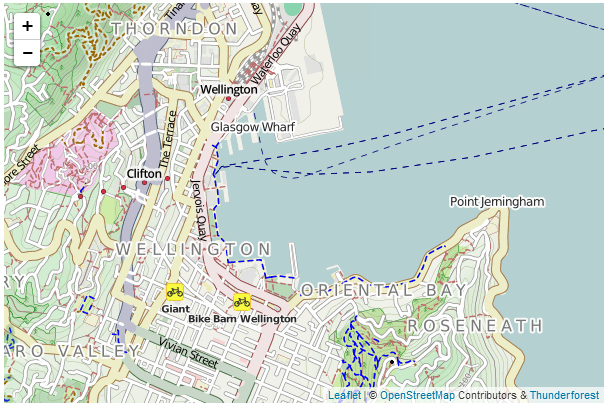
Outdoors
The ‘Outdoors’ set of map tiles is distributed by the good folks at Thunderforest who brought you OpenCycleMap. The tiles are aimed towards outdoor enthusiasts - for hiking, skiing and other activities. They are based on data from the OpenStreetMap project.
URL Template
Usage policy
There are some simple guidelines on the Thunderforest terms and conditions page. The main concern with usage is the load placed on resources. So be gentle.
Attribution
Thunderforest provides open data, under a Creative Commons licence, specifically CC-BY-SA 2.0. The full details are available on their terms and conditions page. Attribution must be given to both “Thunderforest” and “OpenStreetMap contributors”. Users of your map must have a working link to www.thunderforest.com.
Usage example
mapLink = '<a href="http://openstreetmap.org">OpenStreetMap</a>';
outlink = '<a href="http://thunderforest.com/">Thunderforest</a>';
L.tileLayer(
'http://{s}.tile.thunderforest.com/outdoors/{z}/{x}/{y}.png', {
attribution: '© '+mapLink+' Contributors & '+outlink,
maxZoom: 18,
}).addTo(map);
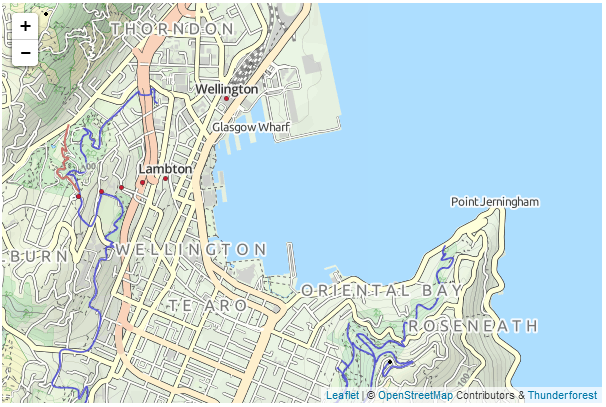
Transport
The ‘Transport’ set of map tiles is distributed by the good folks at Thunderforest who brought you OpenCycleMap. The tiles are designed to show a high level of detail of available public transport. They are based on data from the OpenStreetMap project.
URL Template
Usage policy
There are some simple guidelines on the Thunderforest terms and conditions page. The main concern with usage is the load placed on resources. So be gentle.
Attribution
Thunderforest provides open data, under a Creative Commons licence, specifically CC-BY-SA 2.0. The full details are available on their terms and conditions page. Attribution must be given to both “Thunderforest” and “OpenStreetMap contributors”. Users of your map must have a working link to www.thunderforest.com.
Usage example
mapLink = '<a href="http://openstreetmap.org">OpenStreetMap</a>';
translink = '<a href="http://thunderforest.com/">Thunderforest</a>';
L.tileLayer(
'http://{s}.tile.thunderforest.com/transport/{z}/{x}/{y}.png', {
attribution: '© '+mapLink+' Contributors & '+translink,
maxZoom: 18,
}).addTo(map);
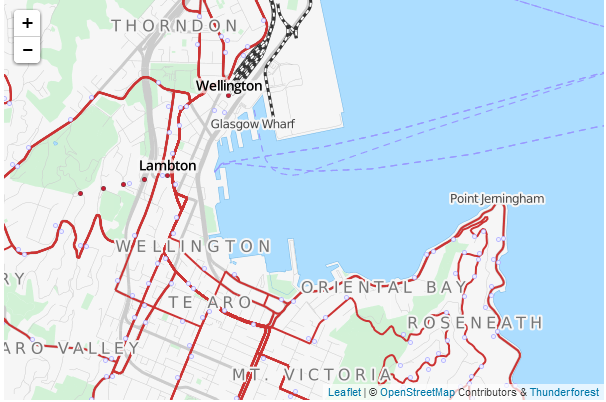
Landscape
The ‘Landscape’ set of map tiles is distributed by the good folks at Thunderforest who brought you OpenCycleMap. The tiles have a global style focussed on information about the natural world - ideal for rural context. They are based on data from the OpenStreetMap project.
URL Template
Usage policy
There are some simple guidelines on the Thunderforest terms and conditions page. The main concern with usage is the load placed on resources. So be gentle.
Attribution
Thunderforest provides open data, under a Creative Commons licence, specifically CC-BY-SA 2.0. The full details are available on their terms and conditions page. Attribution must be given to both “Thunderforest” and “OpenStreetMap contributors”. Users of your map must have a working link to www.thunderforest.com.
Usage example
mapLink = '<a href="http://openstreetmap.org">OpenStreetMap</a>';
landlink = '<a href="http://thunderforest.com/">Thunderforest</a>';
L.tileLayer(
'http://{s}.tile.thunderforest.com/landscape/{z}/{x}/{y}.png', {
attribution: '© '+mapLink+' Contributors & '+landlink,
maxZoom: 18,
}).addTo(map);
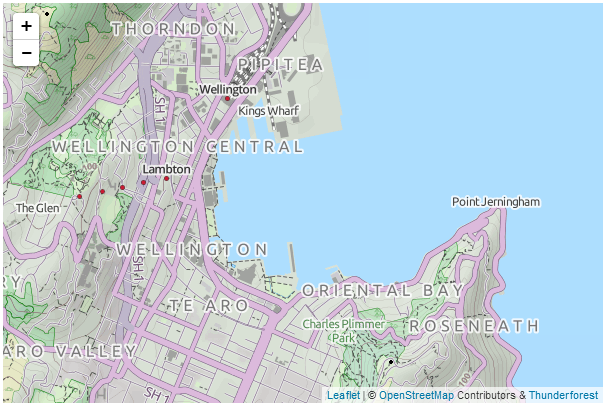
MapQuest Open Aerial
The ‘MapQuest Open Aerial’ tiles are a collection of aerial imagery that covers the globe at varying levels of detail depending on location. The imagery originated from NASA/JPL-Caltech and U.S. Depart. of Agriculture, Farm Service Agency.
The tiles are distributed by the good folks at MapQuest who also distribute a set of OSM tiles called MapQuest-OSM. Global coverage is provided at zoom levels 0-11. Zoom Levels 12+ are provided only in the United States (lower 48).
URL Template
Usage policy
There are some generalised direction (and lots of other good stuff) on the MapQuest-OSM Tiles + MapQuest Open Aerial Tiles page. They are all very reasonable and sensible and are concerned with making sure that the load on the service is not unduly onerous. There is also a link to their official ‘Terms of use’ page which is a more formal wording of their common sense instructions.
Attribution
If using the MapQuest Open Aerial Tiles, attribution is required to read; “Portions Courtesy NASA/JPL-Caltech and U.S. Depart. of Agriculture, Farm Service Agency” (which is quite long and on the example picture used later in the section results in a serious word-wrapping). Additionally they ask that “Tiles Courtesy of MapQuest” be placed on the map along with their logo and a link from the ‘MapQuest’ portion that goes to ‘http://www.mapquest.com/’.
Usage example
This usage example is slightly more complex in that it involves a slightly different approach to including the subdomains. Leaflet will normally operate with subdomains of the form a, b and c, but in this example we find otile1, otile2, otile3 and otile4. To accommodate this the otile portion is included in the URL and the variable parts of the subdomain are declared in a separate option called subdomains.
mapquestLink = '<a href="http://www.mapquest.com//">MapQuest</a>';
mapquestPic = '<img src="http://developer.mapquest.com/content/osm/mq_logo.png">';
L.tileLayer(
    'http://otile{s}.mqcdn.com/tiles/1.0.0/sat/{z}/{x}/{y}.png', {
    attribution: 'Portions Courtesy NASA/JPL-Caltech and U.S. Depart. of Agricult\
ure, Farm Service Agency. Tiles courtesy of '+mapquestLink+mapquestPic,
    maxZoom: 18,
    subdomains: '1234',
    }).addTo(map);
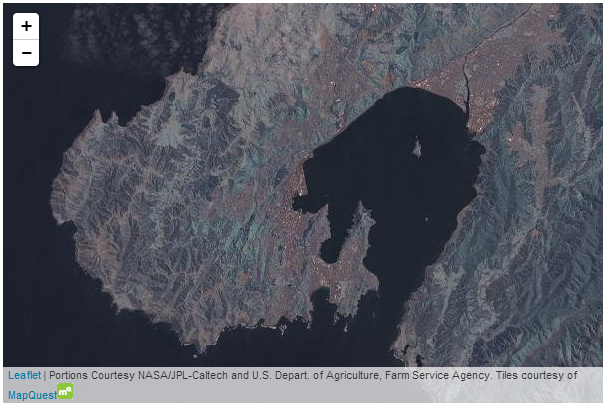
MapQuest-OSM
The ‘MapQuest-OSM’ tiles are a MapQuest styled variation on the OSM dataset.
The tiles are distributed by the good folks at MapQuest who also distribute a set of OSM tiles called MapQuest Open Aerial with satellite imagery.
URL Template
Usage policy
There are some generalised direction (and lots of other good stuff) on the MapQuest-OSM Tiles + MapQuest Open Aerial Tiles page. They are all very reasonable and sensible and are concerned with making sure that the load on the service is not unduly onerous. There is also a link to their official ‘Terms of use’ page which is a more formal wording of their common sense instructions.
Attribution
If using the MapQuest-OSM tiles, appropriate copyright attribution is required to OpenStreetMap. Additionally they ask that “Tiles Courtesy of MapQuest” be placed on the map along with their logo and a link from the ‘MapQuest’ portion that goes to ‘http://www.mapquest.com/’.
Usage example
This usage example is slightly more complex in that it involves a slightly different approach to including the subdomains. Leaflet will normally operate with subdomains of the form a, b and c, but in this example we find otile1, otile2, otile3 and otile4. To accommodate this the otile portion is included in the URL and the variable parts of the subdomain are declared in a separate option called subdomains.
mapLink = '<a href="http://openstreetmap.org">OpenStreetMap</a>';
mapquestLink = '<a href="http://www.mapquest.com//">MapQuest</a>';
mapquestPic = '<img src="http://developer.mapquest.com/content/osm/mq_logo.png">';
L.tileLayer(
'http://otile{s}.mqcdn.com/tiles/1.0.0/map/{z}/{x}/{y}.png', {
attribution: '© '+mapLink+'. Tiles courtesy of '+mapquestLink+mapquestPi\
c,
maxZoom: 18,
subdomains: '1234',
}).addTo(map);
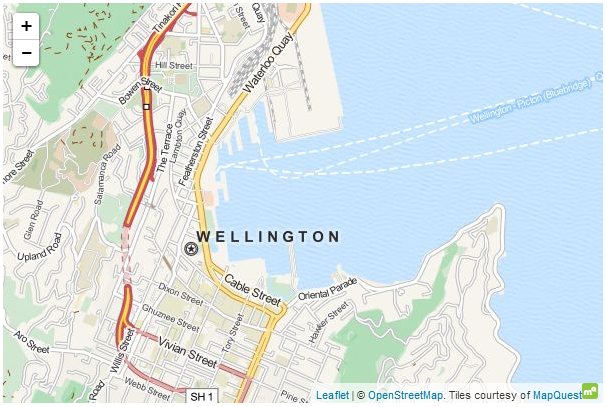
Stamen.Watercolor
The ‘Stamen.Watercolor’ tiles are a beautiful watercolor themed series of maps based on (I believe) OpenStreetMap data.
The tiles are distributed by the good folks at Stamen who also support a mapping solution / thingy called Map Stack and do some astonishing design work.
URL Template
Usage policy
I couldn’t locate any official guidance on usage, so I’m going to make the assumption that any use should fall into the ‘reasonable’ category and advise that if you are thinking of using their maps for anything remotely ‘substantial’ or commercial that you contact them.
Attribution
If using the Stamen.Watercolor tiles, appropriate copyright attribution is required to OpenStreetMap. Additionally in spite of not finding any official guidance on their web site, it would seem appropriate (at a minimum) that recognition of the source as ‘Stamen Design’ with a link would be required. Again, if you are considering using their tiles for any kind of commercial project, you should contact them.
Usage example
mapLink =
'<a href="http://openstreetmap.org">OpenStreetMap</a>';
wholink =
'<a href="http://stamen.com">Stamen Design</a>';
L.tileLayer(
'http://{s}.tile.stamen.com/watercolor/{z}/{x}/{y}.jpg', {
attribution: '© '+mapLink+' Contributors & '+wholink,
maxZoom: 18,
}).addTo(map);
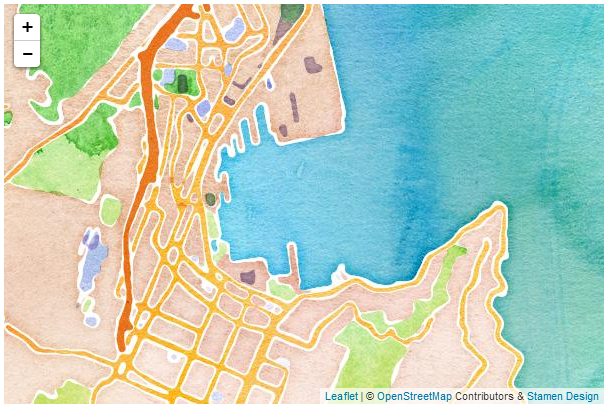
Esri World Imagery
The Esri World Imagery tiles are an outstanding set of maps that are made up of a combination of photo imagery sets of the Earth at different scales.
The tiles are distributed by the good folks at Esri who also support a range of other excellent tile sets.
URL Template
The following URL template may suffer from word wrapping in your electronic publication format. It may therefore be better to get a more accurate copy from an online version which can be found here in Github or from the visual version on bl.ocks.org.
Usage policy
Esri has a full terms of use statement here and a human readable version here. It boils down to making sure that you understand the typical usage of the tiles as well and the organisation that is using them (there are different conditions for Government, Education, and NGO users). There are also good common sense rules on bulk downloading and redistribution (don’t do it).
Attribution
Because there is a wide range of imagery used in the tile set, there are a lot of organisations that require attribution. This includes Esri, DigitalGlobe, GeoEye, i-cubed, USDA FSA, USGS, AEX, Getmapping, Aerogrid, IGN, IGP, swisstopo, and the GIS User Community. Of course if you’re going to make a small map, that list is going to wrap at the bottom (as in the example picture below), so if you don’t want that, you will want to come up with an alternative arrangement.
Usage example
The following script may suffer from word wrapping in your electronic publication format. It may therefore be better to get a more accurate copy from an online version which can be found here in Github or from the visual version on bl.ocks.org.
mapLink =
'<a href="http://www.esri.com/">Esri</a>';
wholink =
'i-cubed, USDA, USGS, AEX, GeoEye, Getmapping, Aerogrid, IGN, IGP, UPR-EGP, and\
the GIS User Community';
L.tileLayer(
'http://server.arcgisonline.com/ArcGIS/rest/services/World_Imagery/MapServer/ti\
le/{z}/{y}/{x}', {
attribution: '© '+mapLink+', '+wholink,
maxZoom: 18,
}).addTo(map);
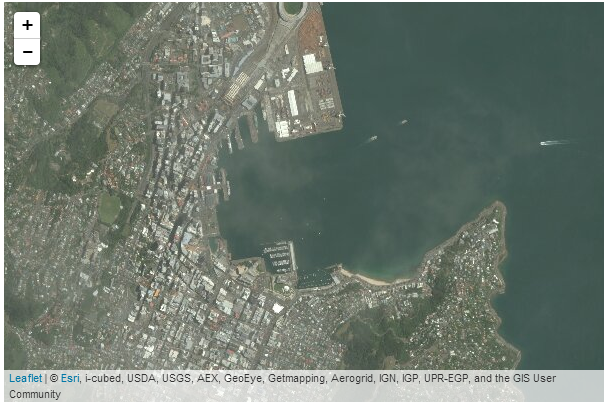
Map Tips and Tricks
How do maps get presented on a web page?
Vectors and bitmaps.
This is a pretty large topic and as you will probable know, there are a lot of alternatives for viewing maps on the internet. But ultimately they all need to put a picture on a screen. There is more than one way to do this, with the largest difference being the presentation of the image on the screen being either a vector image or a bitmap.
Vector graphics
Vector graphics use a technique of drawing an image that relies more on a description of an image than the final representation that a user sees. Instead of arranging individual pixels, an image is created by describing the way the image is created. For instance, drawing a line would be accomplished by defining two sets of coordinates and specifying a line of a particular width and colour be drawn between the points. This might sound a little long winded, and it does create a sense of abstraction, but it is a powerful mechanism for drawing as there is no loss of detail with increasing scale. Changes to the image can be simply carried out by adjusting the coordinates, colour description, line width or curve diameter. This is the technique that is commonly used with d3.js when generating a map from geojson or topojson data.
As a demonstration of the difference, here is a vector image (from a d3.js example) which I have saved at varying zoom levels.
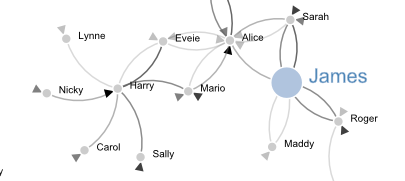
Enlarged by doubling it’s size (x 2) everything looks smooth.
If we enlarge it by doubling again (x 4) , it still looks good.

Doubling again (x 8) and we can see that the text ‘James’ is actually composed of a fill colour and a border.

Doubling again for the last time (x 16) everything still retains it’s clear sharp edges.

Bitmap graphics
A bitmap (or raster) image is one that is composed of lots of discrete individual dots (let’s call them pixels) which, when joined together (and zoomed out a bit) give the impression of an image. Bitmaps can be saved in a wide range of formats depending on users requirements including compression, colour depth, transparency and a host of other attributes. Typically they can be identified by the file suffix .jpg, .png or .bmp (and there are an equally large number of other suffixes). This is what will be presented by by most of the major online map service providers such as Google, Microsoft, Open Street Map and others when a map appears in your browser.
If we use the same image as demonstrated in the description of vectors, and look at a screen shot (and it’s important to remember that this is a screen shot) of the image we see a picture that looks fairly benign.
However, as we enlarge the image by doubling it’s size (x 2) we begin to see some rough edges appear.
And if we enlarge it by doubling again (x 4) , it starts to look decidedly rough.
Doubling again (x 8), starts to show the pixels pretty clearly.

Doubling again for the last time (x 16) and the pixels are plainly evident.

Vectors and bitmaps for maps.
Setting aside satellite / aerial imagery (which is the result of a photograph being taken of a geographic location), maps are not made by users drawing bitmaps of locations. The information is stored as data that is more akin to vector information. A road will be an array of geographic points that are joined up and given a name and other descriptive data. But presenting that information on a web page in that format can be slightly problematic. There are browser compatibility and formatting issues that can make the process difficult and the end result inconsistent. However, pretty much every browser will render a bitmap on the screen without any trouble. So online map providers generate bitmaps from their vector data which they can use to provide a simple consistent interface for presentation.
The only problem with supplying bitmaps of geographical information is that to get a high level of resolution for an area, you have to have a really large image. This would be difficult to handle in a browser and a tremendous burden on download time. The solution to this is to break up the bitmap into smaller sections called tiles.
Map tiles and zoom levels
Before we get serious about showing you some tile goodness, please be aware that the reproduction of Open Street Map data is made possible under the Open Database License, and if using their map tiles, the cartography is licensed as CC BY-SA. For more information on the Copyright and License obligations please visit their page here.
To break a picture of a map up into small manageable sections (tiles) the tile server that produces the tiles will distinguish between different levels of zoom and for each level they will have a different set of tiles that correspond to different locations on the map. Since the (almost universal) standard for tile size is 256 x 256 pixels, at zoom level 0 the entire world is encapsulated in a single 256 x 256 pixel tile.
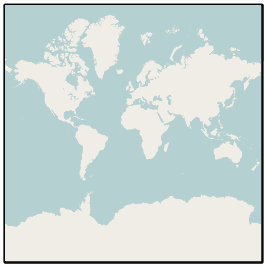
With every subsequent increase in zoom level there is a doubling of the resolution available and therefore an increase in the number of tiles by a factor of four.
So at zoom level 1 there are four tiles…
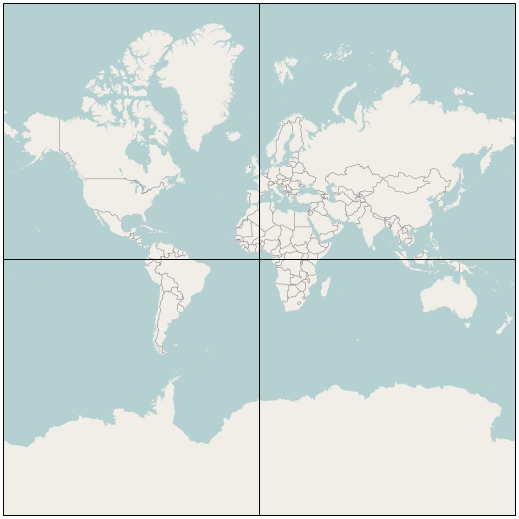
At zoom level 2 there are 16 tiles…
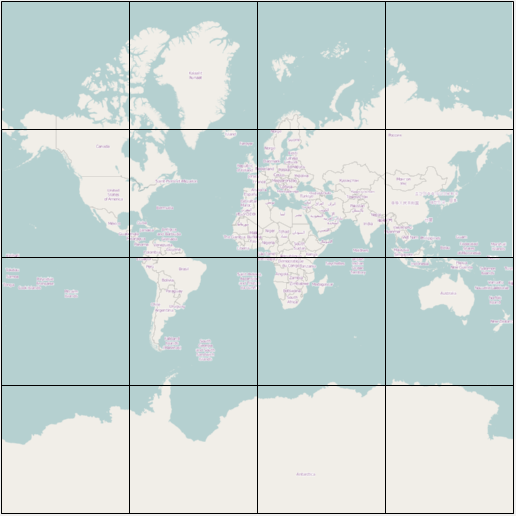
Etc, etc.
I’m sure you can appreciate that each increases in zoom level has the consequence of substantially increasing the number of tiles required. When we get to zoom level 18 there would be a requirement to have over 68 billion tiles (actually 68,719,476,736). The good news is that at the higher zoom levels there are a significant number of tiles that show nothing of interest ( I would be interested in knowing how many 256 x 256 tiles of blue sea there would be) and because tiles are only rendered when someone actually views them, the number of tiles that are produced at the higher zoom levels is a lot less than the theoretical number required. In fact as of 2011 there were only just over 617 million tiles at zoom level 18 rendered meaning that less than 1% of the potential viewable tiles at that level had ever been requested.
Calculations on the Open Street Map wiki give the theoretical volume of data required if all tiles up to zoom level 18 were rendered as 54 Terabytes of storage. But by judicious use of rendering only those required tiles, they report the volume required for storage as of January 2012 as just over 1.2 Terabytes.
How are the tiles on a map server organised?
There are a few different ways that this section could be titled. It could be “What are the names of the pictures used for tiles?” or “How does leaflet.js know what tiles to load?” and I’m sure that there are other variations.
We’ve established that maps are broken down by zoom levels and varying numbers of tiles for these zoom levels. In order for leaflet.js to use these tiles in the right way there needs to be a pattern that can be followed to make sure that the correct ones get from the tile server to the client’s (that’s you) machine.
If you’re generally familiar with the URL templates used for including tile servers to be used with leaflet.js, you will recall that they are formatted something like;
The {z}/{x}/{y} portion of the path to the png file is the description of how the files are stored.
- The
{z}directory denotes the zoom level being loaded. - The
{x}directory denotes the position on the x axis of the tile. - The
{y}designator is the name of the tile which describes its position on the y axis.
For example, the lowest zoom level (the one with the greatest view of area per tile) is stored as 0/0/0.png.
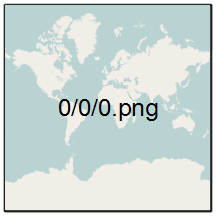
The full URL (if you want to check) is http://a.tile.openstreetmap.org/0/0/0.png.
Then at zoom level 1 the tiles are arranged as follows;
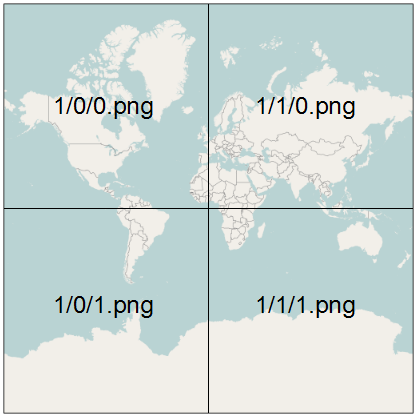
MySQL Tips and Tricks for leaflet.js
Using a MySQL database as a source of data.
Dear reader… If you’re lucky enough to have read “D3 Tips and Tricks” you will know that there’s a chapter in it that deals with installing and using MySQL to store and access data for use with d3.js. If you have used this technique before, you will not be surprised to learn that the same options apply for leaflet.js. The following is therefore a reprint of the instructions for installing MySQL and creating a database. There are some slight editing differences, but don’t be surprised if it looks similar. It is :-). The example at the end for loading the data into a web page uses a leaflet.js map, so there are some relevant changes. Likewise we will be going over different methods for loading external sources in a separate chapter and that will include loading from a MySQL database.
PHP is our friend
As outlined at the start of the book, PHP is commonly used to make web content dynamic. We are going to use it to do exactly that by getting it to glue together our leaflet.js JavaScript and a MySQL Database. The end result should be a web page that will leverage the significant storage capability of a MySQL database and the ability to vary different aspects of returned data.
phpMyAdmin
I’m not one to dwell on the command line for too long if it can be avoided (sorry). So in this section you’ll see me delving into a really neat program for managing your MySQL database called phpMyAdmin (http://www.phpmyadmin.net/home_page/index.php).
As the name would suggest, it’s been written in PHP and as we know, that’s a sign that we’re talking about a web based application. In this case phpMyAdmin is intended to allow a wide range of administrative operations with MySQL databases via a web browser. You can find a huge amount of information about it on the web as it is a freely available robust platform that has been around for well over a decade.
If you have followed my suggestion earlier in the book to install WAMP or you have phpMyAdmin installed already you’re in luck. If not, I’m afraid that I won’t be able to provide any guidance on its installation. I just don’t have the experience to provide that level of support.
Create your database
Assuming that you do have WAMP installed, you will be able to access a subset of its functions from the icon on your system tray in the lower right hand corner of your screen.
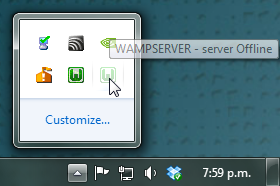
Clicking on this icon will provide you with a range of options, including opening phpMyAdmin.
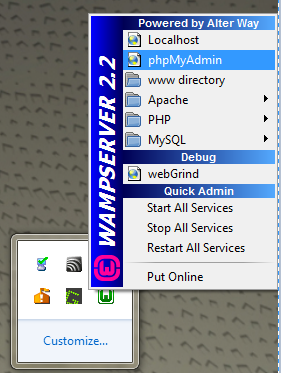
Go ahead and do this and the phpMyAdmin page will open in your browser.
The page you’re presented with has a range of tabs, and we want to select the ‘Databases’ tab.
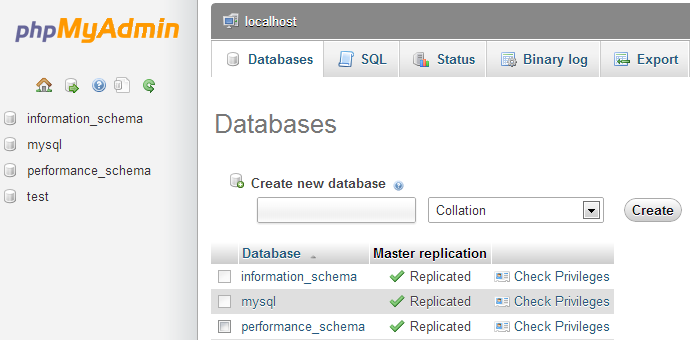
From here we can create ourselves a new database simply by giving it a name and selecting ‘Create’. I will create one called ‘homedb’.

That was simple!
On the panel on the left hand side of the screen is our new database. Go on and click on it.
Cool, now we get to create a table. What’s a table? Didn’t we create our database already?
So, lets create a table called data2 with three columns.

I’ve chosen data2 as a name since we will put the same data as we have in a file called data2.csv. That’s why there are three columns for the date, close and open columns that we have in the data2.csv file.
So, after clicking on the ‘Go’ button, I get the following screen where I get to enter all the pertinent details about what I will have in my table.

I’m keeping it really simple by setting the ‘date’ column to be plain text (It could be set as a ‘DATE’ format, but we’ll keep it simple for the time being), and the two numeric columns to be decimals with 8 digits overall and 2 of those places for the digits to the right of the decimal point.
Once entered, you can scroll down to the bottom of that window and select the ‘Save’ button.
Cool, now you are presented with your table (click on the table name in the left hand panel) and the details of it in the main panel.
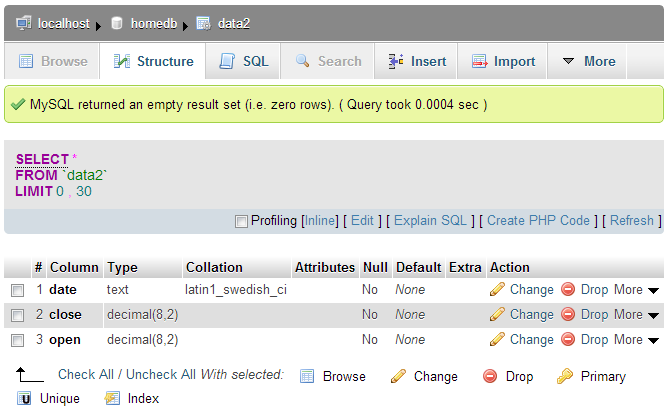
Sure it looks snazzy, but there’s something missing….. Hmm…..
Ah Ha! Data!
Importing your data into MySQL
So, you’ve got a perfectly good database and an impeccably set up table looking for some data.
It’s time we did something about that.
In the vein of “Here’s one I prepared earlier”, what we will do is import a csv (Comma Separated Value) file into our database. To do this I prepared our data2.csv file by removing the header line (with date, close and open on it), so it looks like this;
I know it doesn’t look quite as pretty, but csv files are pretty ubiquitous which is why so many different programs support them as an input and output file type. (To save everyone some time and trouble I have saved the data.csv file into the Leaflet Tips and Tricks example files folder which is available when you download the book from Leanpub).
So armed with this file, click on the ‘Import’ tab in our phpMyAdmin window and choose your file.
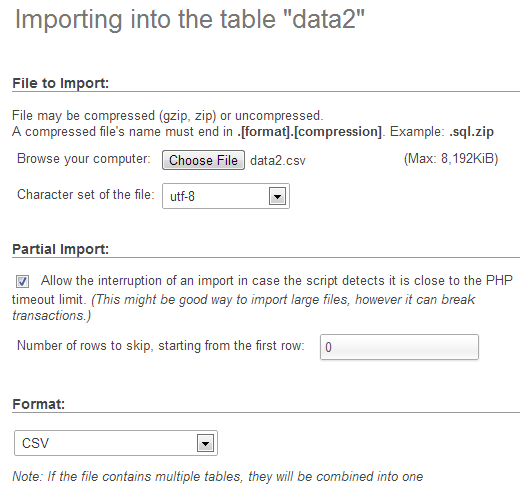
The format should be automatically recognised and the format specific options at the bottom of the window should provide sensible defaults for the input. Let’s click on the ‘Go’ button and give it a try.

Woo Hoo!
Now if you click on the browse tab, there’s your data in your table!
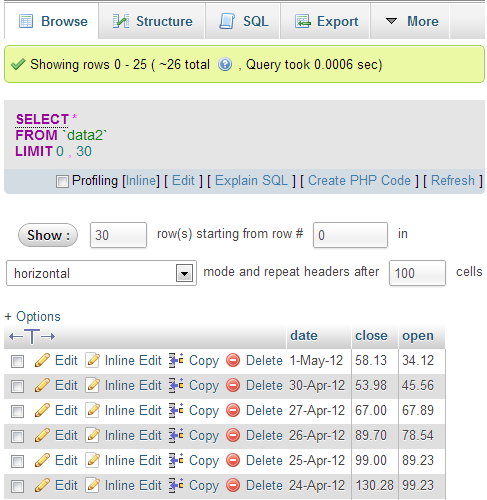
Sweet!
The last thing that we should do is add a user to our database so that we don’t end up accessing it as the root user (not too much of a good look).
So select the ‘homedb’ reference at the top of the window (between ‘localhost’ and ‘data2’).

Then click on the ‘Privileges’ tab to show all the users who have access to ‘homedb’ and select ‘Add a new user’
Then on the new user create a user, use the ‘Local’ host and put in an appropriate password.
In this case, the user name is ‘homedbuser’ and the password is ‘homedbuser’ (don’t tell).
The other thing to do is restrict what this untrusted user can do with the database. In this case we can fairly comfortably restrict them to ‘SELECT’ only;
Click on ‘Go’ and you have yourself a new user.

Yay!
Believe it or not, that’s pretty much it. There were a few steps involved, but they’re hopefully fairly explanatory and I don’t imagine there’s anything too confusing that a quick Googling can’t fix.
Querying the Database
OK, are you starting to get excited yet? We’re just about at the point where we can actually use our MySQL database for something useful!
To do that we have to ask the database for some information and have it return that information in a format we can work with.
The process of getting information from a database is called ‘querying’ the database, or performing a ‘query’.
Now this is something of an art form in itself and believe me, you can dig some pretty deep holes performing queries. However, we’re going to keep it simple. All we’re going to do is query our database so that it returns the ‘date’ and the ‘close’ values.
We’ll start by selecting our ‘data2’ table and going to the ‘Browse’ tab.
We actually already have a query operating on our table. It’s the bit in the middle that looks like;
SELECT *
FROM `data2`
LIMIT 0, 30
This particular query is telling the database homedb (since that’s where the query was run from) to SELECT everything (*) FROM the table data2 and when we return the data, to LIMIT the returned information to those starting at record 0 and to only show 30 at a time.
You should also be able to see the data in the main body of the window.
So, let’s write our own query. We can ask our query in a couple of different ways. Either click on the ‘SQL’ tab and you can enter it there, or click on the menu link that says ‘Edit’ in the current window. I prefer the ‘Edit’ link since it opens a separate little window which let’s you look at the returned data and your query at the same time.
So here’s our window and in it I’ve written the query we want to run.
SELECT `date`, `close` FROM `data2`
You will of course note that I neglected to put anything about the LIMIT information in there. That’s because it gets added automatically to your query anyway using phpMyAdmin unless you specify values in your query.
So in this case, our query is going to SELECT all our values of date and close FROM our table data2.
Click on the ‘Go’ button and let’s see what we get.
There we go!
If you’re running the query as ‘root’ you may see lots of other editing and copying and deleting type options. Don’t fiddle with them and they won’t bite.
Righto… That’s the query we’re going to use. If you look at the returned information with a bit of a squint, you can imagine that it’s in the same type of format as the *.tsv or *.csv files. (header at the top and ordered data underneath).
All that we need to do now is get our MySQL query to output data into leaflet.js.
Enter php!
Using php to extract json from MySQL
Now’s the moment we’ve been waiting for to use php!
What we’re going to do is use a php script that performs the query that extracts data out of a database it in a way that we can input it into Leaflet really easily.
Our php script is going to exist as a separate file which we will name planelatlong.php (ideally we would place this in a separate directory called php which will be in our web’s root directory (alongside the data directory) but for the sake of simplicity we will have our ‘calling’ file (the one with the leaflet.js script) and this php script in the same directory).
The database that we’re going to access is one that contains a range of values. Two of which are the latitude and longitude of a plane in flight. The database is organised as follows;

In our example we will pull out only the rows with the latitude and longitude and return only them in a format that the script will recognise as follows;
	var planelatlong = [
	  [-41.31825,174.80768],
	  [-41.31606,174.80774],
	  [-41.31581,174.80777],
	  [-41.31115,174.80827],
	  [-41.30928,174.80835],
	  [-41.29127,174.83841],
	  [-41.33571,174.84846],
	  [-41.34268,174.82877]];
We’ll follow an example of how to get this imported into a leaflet.js script after we’ve gone through the explanation of how to generate the data.
Here’s the contents of our planelatlong.php file (This is also available in electronic form in the zip file of example scripts that can be downloaded when you download the book from Leanpub);
<?php
    $username = "planeuser";
    $password = "planeuser";
    $host = "localhost";
    $database="planedb";

    $server = mysql_connect($host, $username, $password);
    $connection = mysql_select_db($database, $server);

    $myquery = "
SELECT  `lat`, `long` FROM  `test01`
WHERE `lat` <> 0
";
    $query = mysql_query($myquery);

    if ( ! $query ) {
        echo mysql_error();
        die;
    }

    $data = array();

	echo "var planelatlong = [";

    for ($x = 0; $x < mysql_num_rows($query); $x++) {
        $data[] = mysql_fetch_assoc($query);
        echo "[",$data[$x]['lat'],",",$data[$x]['long'],"]";
        if ($x <= (mysql_num_rows($query)-2) ) {
			echo ",";
		}
    }

    	echo "];";

    mysql_close($server);
?>
It’s pretty short, but it packs a punch. Let’s go through it and see what it does.
The <?php line at the start and the ?> line at the end form the wrappers that allow the requesting page to recognise the contents as php and to execute the code rather than downloading it for display.
The following lines set up a range of important variables;
    $username = "planeuser";
    $password = "planeuser";
    $host = "localhost";
    $database="planedb";
Hopefully you will recognise that these are configuration details for the MySQL database. There’s user and password (don’t worry, because the script isn’t returned to the browser, the browser doesn’t get to see the password). There’s the host location of our database (in this case it’s local, but if it was on a remote server, we would just include its address) and there’s the database we’re going to access.
Then we use those variables to connect to the server…
$server = mysql_connect($host, $username, $password);
… and then we connect to the specific database;
$connection = mysql_select_db($database, $server);
Then we have our query in a form that we can paste into the right spot and it’s easy to use.
    $myquery = "
SELECT  `lat`, `long` FROM  `test01`
WHERE `lat` <> 0
";
I have it like this so all I need to do to change the query I use is to paste it into the middle line there between the speech-marks and I’m done. It’s just a convenience thing.
The query itself is a fairly simple affair. We return lat and long from our table called test01 but only if the lat value on the row is not equal to zero (WHERE lat <> 0) (this will allow us to ignore the rows which do not contain a latitude (and typically a longitude in this case) value.
The query is then run against the database with the following command;
$query = mysql_query($myquery);
… and then we check to see if it was successful. If it wasn’t, we output the MySQL error code;
    if ( ! $query ) {
        echo mysql_error();
        die;
    }
Then we declare the $data variable as an array;
$data = array();
Now we begin to echo or print out the values for our piece of code that we expect to have inserted into our leaflet.js code;
First of all we print out the start of the declaration of our array;
echo "var planelatlong = [";
Then we start up a for loop that goes from 0 ($x = 0;) to the number of returned rows in our query ($x < mysql_num_rows($query)) one step at a time ($x++)
for ($x = 0; $x < mysql_num_rows($query); $x++) {
We place our rows into our $data array…
$data[] = mysql_fetch_assoc($query);
… and then echo each row as a latitude and longitude value enclosed by square brackets and separated by a comma;
echo "[",$data[$x]['lat'],",",$data[$x]['long'],"]";
So that each line looks a little like this
[-41.31825,174.80768]
Because we need to separate our lat/long values that are enclosed with brackets from each other with a comma like this…
	[-41.31825,174.80768],
	[-41.31606,174.80774]
… but we don’t want a comma after the last lat/long pair. We can use an if statement to evaluate each row to see if it’s the last and print a comma if its not;
        if ($x <= (mysql_num_rows($query)-2) ) {
			echo ",";
		}
After the our rows have finished being produced by our loop we need to close it off with another square bracket;
echo "];";
And all that remains is to close the connection to our MySQL database;
mysql_close($server);
Whew!
That was a little fast and furious, but I want to revisit the point that we covered in the part about echoing the data back to whatever had requested it. This is because we are going to use it directly in our leaflet.js script, but we can actually run the script directly by opening the file in our browser.
So if you can navigate using your browser to this file and click on it to run it (WAMP should be your friend here again) this is what you should see printed out on your screen (at least the information, but probably not formatted as nicely);
	var planelatlong = [
	  [-41.31825,174.80768],
	  [-41.31606,174.80774],
	  [-41.31581,174.80777],
	  [-41.31115,174.80827],
	  [-41.30928,174.80835],
	  [-41.29127,174.83841],
	  [-41.33571,174.84846],
	  [-41.34268,174.82877]];
There it is! A nicely declared array of latitude / longitude points!
It looks a bit unusual on the printed page, but it’s bread and butter for JavaScript.
I have included the planelatlong.php file with the files available when you download the Leaflet Tips and Tricks book.
Getting the data into leaflet.js
Let’s recap momentarily.
We have created a database, populated it with information, worked out how to extract a subset of that information and how to do it in a format that is valid (won’t cause an error) JavaScript. Now for the final act!
If we consider a php file that we would use to display a web page with a leaflet map and a line, it could look something like this;
<?php ?>
<!DOCTYPE html>
<html>
<head>
<title>Simple Leaflet Map</title>
<meta charset="utf-8" />
<link
rel="stylesheet"
href="http://cdn.leafletjs.com/leaflet-0.7/leaflet.css"
/>
</head>
<body>
<div id="map" style="width: 600px; height: 400px"></div>
<script
src="http://cdn.leafletjs.com/leaflet-0.7/leaflet.js">
</script>
<script>
	var planelatlong = [
	  [-41.31825,174.80768],
	  [-41.31606,174.80774],
	  [-41.31581,174.80777],
	  [-41.31115,174.80827],
	  [-41.30928,174.80835],
	  [-41.29127,174.83841],
	  [-41.33571,174.84846],
	  [-41.34268,174.82877]];
var map = L.map('map').setView([-41.3058, 174.82082], 12);
mapLink =
'<a href="http://openstreetmap.org">OpenStreetMap</a>';
L.tileLayer(
'http://{s}.tile.openstreetmap.org/{z}/{x}/{y}.png', {
attribution: '© ' + mapLink + ' Contributors',
maxZoom: 18,
}).addTo(map);
var polyline = L.polyline(planelatlong).addTo(map);
</script>
</body>
</html>
In the middle there is the section where we declare our data array that contains the latitude and longitude values;
var planelatlong = [
[-41.31825,174.80768],
[-41.31606,174.80774],
[-41.31581,174.80777],
[-41.31115,174.80827],
[-41.30928,174.80835],
[-41.29127,174.83841],
[-41.33571,174.84846],
[-41.34268,174.82877]];
That should look remarkable similar (identical) to the output from the planelatlong.php file that we developed in the previous section. All we need to do is to get the output from planelatlong.php to appear in the place of the declared data array.
The is done nice and easily by ‘including’ the php file in the script with the following line;
<?php include 'planelatlong.php'; ?>And that’s it!
The final script will look like the following;
<?php ?>
<!DOCTYPE html>
<html>
<head>
<title>Simple Leaflet Map</title>
<meta charset="utf-8" />
<link
rel="stylesheet"
href="http://cdn.leafletjs.com/leaflet-0.7/leaflet.css"
/>
</head>
<body>
<div id="map" style="width: 600px; height: 400px"></div>
<script
src="http://cdn.leafletjs.com/leaflet-0.7/leaflet.js">
</script>
<script>
<?php include 'planelatlong.php'; ?>
var map = L.map('map').setView([-41.3058, 174.82082], 12);
mapLink =
'<a href="http://openstreetmap.org">OpenStreetMap</a>';
L.tileLayer(
'http://{s}.tile.openstreetmap.org/{z}/{x}/{y}.png', {
attribution: '© ' + mapLink + ' Contributors',
maxZoom: 18,
}).addTo(map);
var polyline = L.polyline(planelatlong).addTo(map);
</script>
</body>
</html>
Of course it still relies on the planelatlong.php script to query the database and return the values, but now you have the ability to dynamically source different data from outside your web file.
This example has been a very quick glance at what we need to do to get data from a MySQL database into Leaflet. I will be including a separate section in the book that will explore a few different options for importing data from external sources.
Appendices
Full Screen Map
<!DOCTYPE html>
<html>
<head>
<title>Simple Leaflet Map</title>
<meta charset="utf-8" />
<link
rel="stylesheet"
href="http://cdn.leafletjs.com/leaflet-0.7/leaflet.css"
/>
<style>
body {
padding: 0;
margin: 0;
}
html, body, #map {
height: 100%;
width: 100%;
}
</style>
</head>
<body>
<div id="map"></div>
<script
src="http://cdn.leafletjs.com/leaflet-0.7/leaflet.js">
</script>
<script>
var map = L.map('map').setView([-41.2858, 174.78682], 14);
mapLink =
'<a href="http://openstreetmap.org">OpenStreetMap</a>';
L.tileLayer(
'http://{s}.tile.openstreetmap.org/{z}/{x}/{y}.png', {
attribution: 'Map data © ' + mapLink,
maxZoom: 18,
}).addTo(map);
</script>
</body>
</html>
Also available online from bl.ocks.org or GitHub.
Leaflet.draw plugin with options.
<!DOCTYPE html>
<html>
<head>
<title>Leaflet.draw Plugin</title>
<meta charset="utf-8" />
<link
rel="stylesheet"
href="http://cdn.leafletjs.com/leaflet-0.7/leaflet.css"
/>
<link
rel="stylesheet"
href="http://leaflet.github.io/Leaflet.draw/leaflet.draw.css"
/>
</head>
<body>
<div id="map" style="width: 600px; height: 400px"></div>
<script
src="http://cdn.leafletjs.com/leaflet-0.7/leaflet.js">
</script>
<script
src="http://leaflet.github.io/Leaflet.draw/leaflet.draw.js">
</script>
<script>
var map = L.map('map').setView([-41.2858, 174.78682], 14);
mapLink =
'<a href="http://openstreetmap.org">OpenStreetMap</a>';
L.tileLayer(
'http://{s}.tile.openstreetmap.org/{z}/{x}/{y}.png', {
attribution: 'Map data © ' + mapLink,
maxZoom: 18,
}).addTo(map);
var LeafIcon = L.Icon.extend({
options: {
shadowUrl:
'http://leafletjs.com/docs/images/leaf-shadow.png',
iconSize: [38, 95],
shadowSize: [50, 64],
iconAnchor: [22, 94],
shadowAnchor: [4, 62],
popupAnchor: [-3, -76]
}
});
var greenIcon = new LeafIcon({
iconUrl: 'http://leafletjs.com/docs/images/leaf-green.png'
});
var drawnItems = new L.FeatureGroup();
map.addLayer(drawnItems);
var drawControl = new L.Control.Draw({
position: 'topright',
draw: {
polygon: {
shapeOptions: {
color: 'purple'
},
allowIntersection: false,
drawError: {
color: 'orange',
timeout: 1000
},
showArea: true,
metric: false,
repeatMode: true
},
polyline: {
shapeOptions: {
color: 'red'
},
},
rect: {
shapeOptions: {
color: 'green'
},
},
circle: {
shapeOptions: {
color: 'steelblue'
},
},
marker: {
icon: greenIcon
},
},
edit: {
featureGroup: drawnItems
}
});
map.addControl(drawControl);
map.on('draw:created', function (e) {
var type = e.layerType,
layer = e.layer;
if (type === 'marker') {
layer.bindPopup('A popup!');
}
drawnItems.addLayer(layer);
});
</script>
</body>
</html>
Also available online at bl.ocks.org or GitHub.
OSMGeocoder plugin with options.
<!DOCTYPE html>
<html>
<head>
<title>osmGeocoder Search Plugin for Leaflet Map</title>
<meta charset="utf-8" />
<link
rel="stylesheet"
href="http://cdn.leafletjs.com/leaflet-0.7/leaflet.css"
/>
<link
rel="stylesheet"
href="http://k4r573n.github.io/leaflet-control-osm-geocoder/Control.OSMGe\
ocoder.css"
/>
</head>
<body>
<div id="map" style="width: 600px; height: 400px"></div>
<script
src="http://cdn.leafletjs.com/leaflet-0.7/leaflet.js">
</script>
<script
src="http://k4r573n.github.io/leaflet-control-osm-geocoder/Control.OSMGeo\
coder.js">
</script>
<script>
var map = L.map('map').setView([-41.2858, 174.78682], 14);
mapLink =
'<a href="http://openstreetmap.org">OpenStreetMap</a>';
L.tileLayer(
'http://{s}.tile.openstreetmap.org/{z}/{x}/{y}.png', {
attribution: '© ' + mapLink + ' Contributors',
maxZoom: 18,
}).addTo(map);
var osmGeocoder = new L.Control.OSMGeocoder({
collapsed: false,
position: 'bottomright',
text: 'Find!',
});
map.addControl(osmGeocoder);
</script>
</body>
</html>
Also available online at bl.ocks.org or GitHub.
